
Описание
MarketSessions – Ваш торговый козырь, визуализированный
Превратите рыночное время в торговую силу
MarketSessions — это профессиональный индикатор для cTrader, который оживляет глобальные рыночные сессии — чтобы вы могли торговать там, где моментум настоящий и время становится вашим преимуществом.
🚀 Почему трейдеры доверяют MarketSessions
Видеть ритм рынка
Мгновенно визуализируйте Лондон, Нью-Йорк, Токио, Сидней — и любую другую сессию, которую хотите — с чистыми, элегантными наложениями, которые адаптируются к вашему графику.
Торгуйте умнее, а не позже
Получайте уведомления в реальном времени, когда сессии открываются, закрываются или достигают ключевых уровней — через Telegram или Discord (на ваш выбор).
Атакуйте зоны с высокой вероятностью
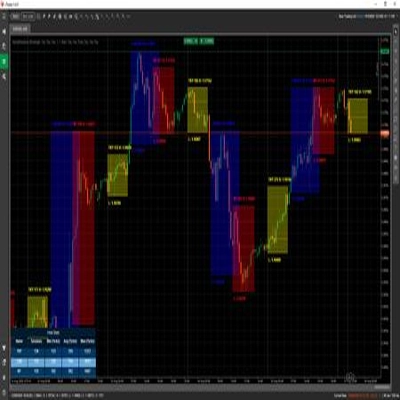
Используйте встроенные инструменты, такие как прорыв диапазона открытия, точка контроля (POC) и точные линии сессии, чтобы вы никогда не пропустили прорыв или отскок.
🎯 Ключевые особенности
- Визуализация и управление сессиями – полностью настраиваемое время, цвета и метки, даже для перекрывающихся рынков
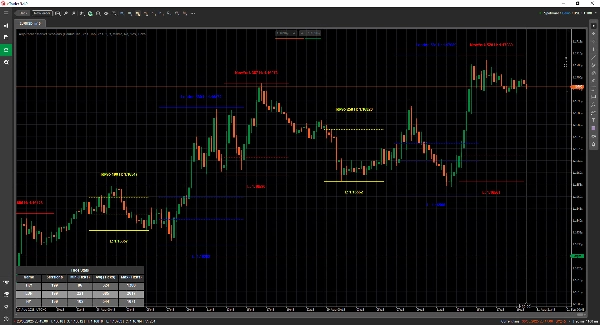
- Продвинутые инструменты рисования – включает двойные ❘❘ и средние линии, прямоугольники прорыва, текстовые маркеры и режим двойной линии для минималистичных трейдеров
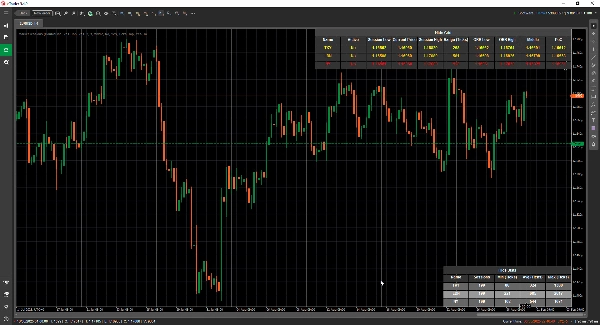
- Панель статистики – просмотр общего количества сессий, минимальных, средних и максимальных диапазонов для каждой сессии (в тиках, пипсах или %)
- Режим сетки - позволяет видеть текущие активные сессии в таблице, чтобы вы могли видеть сессии на более высоком таймфрейме.
- Гибкая настройка – настройка расположения текста, режимов диапазона, предпочтений рисования и тем
- Оповещения и интеграции – интеграция с Telegram/Discord с звуковыми и визуальными оповещениями
📦 Что вы получаете
- MarketSessions.algo (готов к использованию)
- Обновления на всю жизнь (без повторяющихся платежей)
- Дружелюбная поддержка (прямой доступ, если нужна помощь)
💻 Требования
- Платформа cTrader
- Среда выполнения .NET 6.0
✅ Установка за несколько минут
✅ Торгуйте с абсолютной уверенностью
📘 Справочник параметров (дружелюбная версия)
Список доступных сессий
- Нью-Йорк
- Лондон
- Франкфурт
- Токио
- Гонконг
- Шанхай
- Сингапур
- Веллингтон
- Сидней
- Торонто
Общие настройки
- Режим рисования – Выберите, как линии сессии рисуются на графике (прямоугольник / двойная линия / средняя линия)
- Показать название сессии – Отображать название каждой сессии прямо на вашем графике
- Расположение названия сессии – Выберите, где отображается текст названия сессии (сверху, по центру, снизу)
- Жирный текст – Делает название сессии жирным для лучшей читаемости
- Отступ сверху для текста – Добавляет дополнительный отступ сверху (чтобы текст не перекрывал свечи)
- Отступ снизу для текста – Добавляет дополнительный отступ снизу области сессии
- Расположение времени текста – Показывать время сессии вместе с названием сессии
- Использовать короткое название сессии – Переключается на короткие названия (например, NY вместо Нью-Йорк)
- Показать диапазон сессии – Выделить полный ценовой диапазон, охваченный сессией
- Режим диапазона сессии – Выберите, как рассчитывается ценовой диапазон (максимум/минимум или открытие/закрытие)
- Расположение маркера диапазона сессии – Разместить маркер диапазона либо вверху, либо внизу диапазона
- Показать максимум – Отобразить максимальную цену сессии
- Расположение метки максимума – Выберите, где отображается метка максимума
- Показать минимум – Отобразить минимальную цену сессии
- Расположение метки минимума – Выберите, где отображается метка минимума
- Продлить линии максимума/минимума (минуты) - Позволяет продлить эти линии на x минут вперёд
- Показать прорыв диапазона открытия – Нарисовать прямоугольник прорыва при открытии сессии
- Продлить линии ORB (минуты) - Позволяет продлить эти линии на x минут вперёд
- Показать средние линии – Добавить средние линии для определения справедливой стоимости
- Продлить средние линии (минуты) - Позволяет продлить эту линию на x минут вперёд
- Показать PoC – Отобразить точку контроля (самая торгуемая цена сессии)
- Продлить средние линии (минуты) - Позволяет продлить эту линию на x минут вперёд
- Прозрачность заливки – Контролируйте прозрачность фоновой заливки сессии
Статистика
- Отображать статистику – Показать/скрыть панель статистики на вашем графике
- Горизонтальное выравнивание статистики – Выравнивание панели (слева / по центру / справа)
- Вертикальное выравнивание статистики – Выберите, отображается ли панель сверху или снизу
- Цвет заголовка – Цвет текста заголовка «Статистика»
- Цвет чётных строк – Цвет фона для чётных строк в панели
- Цвет нечётных строк – Цвет фона для нечётных строк в панели
- Цвет переднего плана – Цвет текста внутри панели
Telegram
- Использовать – Включить или отключить оповещения Telegram
- Токен – Ваш токен бота Telegram
- ChatId – ID чата, куда будут отправляться оповещения
Discord
- Использовать – Включить или отключить оповещения Discord
- WebhookUrl – URL вебхука Discord для отправки оповещений о сессиях
Звуковые оповещения
- Звуковое оповещение о новой сессии – Воспроизвести звук при начале новой сессии
- Звуковое оповещение о завершении сессии – Воспроизвести звук при окончании сессии
Сетка
- Принудительная сетка - Принудительно отображает сетку независимо от используемого таймфрейма
- Сетка видима для таймфрейма и выше - Позволяет выбрать, с какого таймфрейма и выше отображается сетка
- Уведомление в окне сообщений - Уведомляет, почему обычный режим отображения невозможен и переключается в режим сетки
- Горизонтальное выравнивание сетки
- Вертикальное выравнивание сетки
Пример сессии (Нью-Йорк)
⚠️ Те же параметры применимы к каждой сессии (Лондон, Токио, Сидней и т.д.)
- Активна – Включить или отключить эту конкретную сессию
- Цвет – Цвет сессии, используемый на графике
- Заливка области – Заполнить фон области сессии
- Стиль линии – Выберите стиль линии (сплошная, пунктирная и т.д.)
- Толщина линии – Контролируйте толщину границ сессии
Сделайте рыночные часы своим союзником
Получите MarketSessions сегодня и больше никогда не пропускайте прибыльную сессию.


