Описание
📈 Индикатор Смещения Волатильности – Профессиональная версия (для cTrader)
Откройте для себя более глубокое понимание рыночного давления, дисбаланса волатильности и направленной уверенности с помощью Индикатора Смещения Волатильности, усовершенствованной версии классического подхода на основе волатильности, изначально вдохновлённого Pine Script и теперь полностью оптимизированного для cTrader.
Этот инструмент помогает трейдерам визуализировать какая сторона рынка действует сильнее — покупатели или продавцы — измеряя асимметрию волатильности и преобразуя её в чёткий, легко читаемый сигнал.
Будь то торговля индексами, форексом, товарами или криптовалютой, этот индикатор служит мощным фильтром тренда, детектором режима и инструментом подтверждения смещения.
1. Что измеряет индикатор Смещения
Индикатор оценивает баланс волатильности между бычьими и медвежьими свечами.
Он вычисляет нормализованный True Range и подаёт его в два адаптивных скользящих средних:
- Максимальное отклонение → волатильность, возникающая во время восходящих свечей
- Минимальное отклонение → волатильность, возникающая во время нисходящих свечей
Затем он вычисляет:
👉 Смещение = МаксимальноеОтклонение / МинимальноеОтклонение
Это преобразует сырую волатильность в чёткое направленное значение:
- Смещение > 1 → восходящие движения в среднем сильнее
- Смещение < 1 → нисходящие движения сильнее
- Смещение ≈ 1 → волатильность симметрична, рынок сбалансирован
Короче говоря:
Смещение показывает, какая сторона обладает «доминированием волатильности».
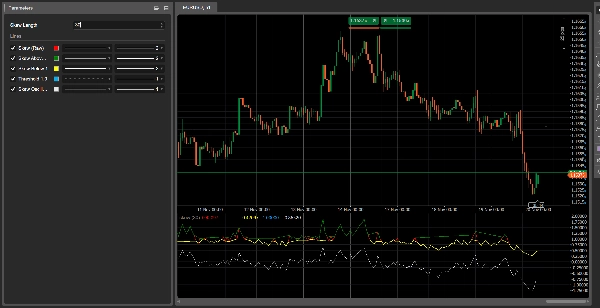
2. Понимание линий
1. Смещение (сырое) – Красная линия
Чистое соотношение волатильности. Это основной сигнал.
2. Смещение выше 1 – Зелёная линия
Показывает доминирование бычьей волатильности.
3. Смещение ниже 1 – Жёлтая линия
Показывает доминирование медвежьей волатильности.
4. Линия порога 1.0 – Синяя пунктирная линия
Представляет равновесие.
5. Осциллятор Смещения (логарифмический) – Белая линия
Более стабильное, сглаженное представление:
- выше 0 = бычья волатильность
- ниже 0 = медвежья волатильность
3. Как читать индикатор
A) Рыночные режимы
🔹 Бычий режим
- Смещение > 1
- Активна зелёная линия
- Осциллятор выше нуля
→ Рынок благоприятствует лонгам.
🔹 Медвежий режим
- Смещение < 1
- Активна жёлтая линия
- Осциллятор ниже нуля
→ Рынок благоприятствует шортам.
🔹 Нейтральный
- Смещение ≈ 1
→ Рынок сбалансирован, подходит для торговли в диапазоне.
4. Сигналы смены режима
Смещение пересекает уровень 1 сверху вниз
→ Покупатели получают доминирование волатильности
→ Бычий переход
Смещение пересекает уровень 1 снизу вверх
→ Продавцы получают доминирование волатильности
→ Медвежий переход
Эти смены часто происходят до подтверждения тренда ценовым движением, делая Смещение мощным ранним индикатором.
5. Практические случаи использования
1️⃣ Фильтр тренда для cBots
- торговать в лонг только когда SkewOsc > 0
- торговать в шорт только когда SkewOsc < 0
2️⃣ Подтверждение качества тренда
- Восходящий тренд + Смещение > 1 = сильный тренд
- Восходящий тренд + Смещение, падающее к 1 = ослабление тренда
3️⃣ Рыночный сентимент / Фильтр риска
Особенно эффективен на индексах и основных валютных парах FX.
6. Итог
- Что показывает: доминирование волатильности
- Почему это важно: сдвиги волатильности предшествуют сдвигам цены
- Как использовать: как фильтр, инструмент подтверждения или индикатор сентимента
- Лучшее: чрезвычайно лёгкий, быстрый и адаптивный
Сводка
Отзывы покупателей
5 | 67 % | |
4 | 33 % | |
3 | 0 % | |
2 | 0 % | |
1 | 0 % |


