説明
スマートキャンドルベースのデルタ計算によるプロフェッショナルな出来高分析
機関投資家レベルの出来高分析の力を解き放つ ANCHORED DELTA CANDLE VOLUME PROFILE、cTrader向けの最も高度なアンカリング出来高プロファイルインジケーターです。正確な市場洞察を求める真剣なトレーダーのために設計されており、インテリジェントなキャンドルベースのデルタ計算を通じて実際の市場活動がどこで起きているかを明らかにします。
🎯 主な特徴
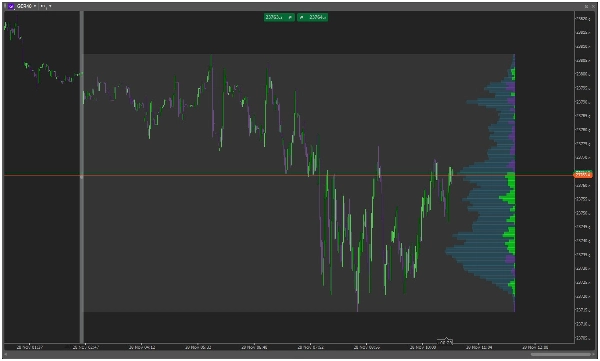
🏓 スマートアンカリングシステム
- チャート上の任意の場所に垂直線を引くだけ
- 選択したポイントにアンカーされた自動プロファイル生成
- 新しい価格変動に応じた動的な更新
📊 インテリジェントなキャンドルベースのデルタ
- キャンドルの方向に基づく高度なデルタ分析
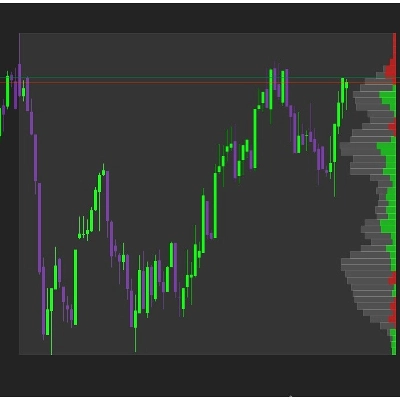
- 緑のキャンドル = 買い出来高 | 赤のキャンドル = 売り出来高
- 価格レベルごとのクリーンで単色の視覚化
- 買い/売り圧力ゾーンの即時識別
🎨 カスタマイズ可能なビジュアルデザイン
- 調整可能なプロファイル幅(範囲の5〜100%)
- 買い/売り/合計出来高のカスタマイズ可能な色
- 完璧なチャート統合のための透明度コントロール
- 読みやすさを高めるプロフェッショナルなシェーディング
⚡ 柔軟な表示モード
- デルタモード: 各価格レベルでの純買い/売り圧力を表示
- ボリュームモード: 従来の出来高プロファイル表示
- チャートスペースの最適利用のための右アンカー表示
🚀 トレーダーが愛用する理由
"ついに、機能する出来高プロファイルが登場!キャンドルベースのデルタ計算は機関投資家の活動を見抜くのに非常に正確です。" - プロフェッショナルトレーダー
"私のマーケットプロファイル分析に革命をもたらしました。アンカリングシステムは素晴らしく、キャンドルベースのアプローチは非常に理にかなっています。" - 機関アナリスト
📈 次の方に最適
- マーケットプロファイルトレーダー - 価値領域や不良高値/安値を特定
- オークションマーケット理論家 - 市場発展プロセスを理解
- 出来高ベースの戦略 - 出来高検証によるブレイクアウトの確認
- 機関フロー分析 - スマートマネーの蓄積/分配を発見
🛠 簡単に使える
- 描く アンカーポイントに垂直線を引く
- 見る ANCHORED DELTA CANDLE VOLUME PROFILEが自動生成されるのを確認
- 分析する 価格レベルごとのデルタ分布を解析
- 取引する 出来高で確認されたレベルを使って自信を持って取引
🔧 技術仕様
- リアルタイム計算
- 低リソース消費
- すべての時間軸に対応
- すべての銘柄(Forex、株式、暗号通貨、先物)で動作
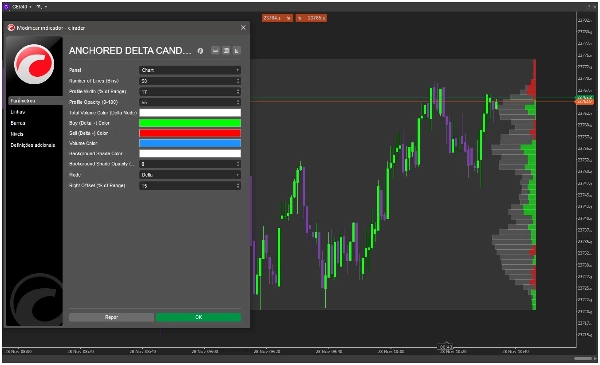
📋 含まれるパラメーター
- ライン/ビンの数(5〜100)
- プロファイル幅の割合
- 不透明度コントロール
- カスタムカラースキーム
- 右オフセット調整
- 表示モード(デルタ/ボリューム)
🎯 今日からチャート分析を変革しましょう!
ANCHORED DELTA CANDLE VOLUME PROFILE を使って市場分析を向上させた何千人ものプロトレーダーに参加しましょう。推測をやめ、正確なキャンドルベースのデルタ計算を通じて実際の市場活動がどこで起きているかを見始めましょう。
⭐ 「このインジケーターがもたらす出来高分析の明快さは比類がありません。キャンドルベースのデルタアプローチは純粋な天才です。」
今日、ANCHORED DELTA CANDLE VOLUME PROFILEをcTraderプラットフォームに追加し、機関レベルの洞察で取引しましょう!


