Deskripsi
# SmartFractalZigZag - Dasar untuk Setiap Metodologi Perdagangan
## Ikhtisar Produk
**SmartFractalZigZag** bukan sekadar indikator lain — ini adalah **fondasi struktural** yang menjadi dasar setiap metodologi perdagangan serius.
Apakah Anda menggunakan **Smart Money Concepts (SMC/ICT)**, **Teori Gelombang Elliott**, **Teori Dow**, **Metode Wyckoff**, **Teori Chan (缠论)**, atau bentuk **analisis aksi harga** — semuanya dimulai dengan satu kebutuhan dasar: **mengidentifikasi struktur pasar dengan akurat**.
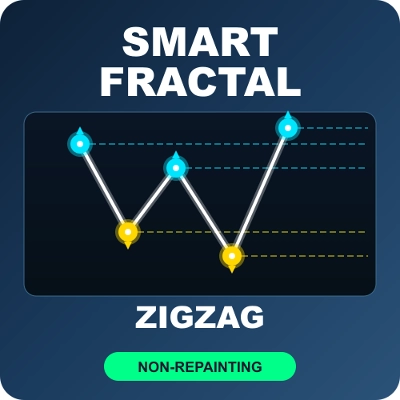
Indikator ini memberikan fondasi tersebut dengan **tanpa repainting**, **sensitivitas yang dapat disesuaikan**, dan **output visual yang bersih**.
---
## Fondasi Universal: Mengapa Struktur Penting
Setiap metodologi perdagangan utama dibangun di atas blok bangunan yang sama:
| Metodologi | Apa yang Mereka Sebut | Apa yang Ditunjukkan SmartFractalZigZag |
|-------------|-------------------|-------------------------------|
| **Support/Resistance** | Level Kunci | Swing tinggi = resistance, swing rendah = support |
| **SMC/ICT** | Swing Tinggi/Rendah, BOS, CHoCH | Titik swing tepat untuk break struktur |
| **Gelombang Elliott** | Pivot Gelombang | Titik pivot jelas untuk penghitungan gelombang |
| **Teori Dow** | Tinggi/Rendah Lebih Tinggi | Struktur tren sekilas |
| **Wyckoff** | Springs, Upthrusts | Ekstrem swing dalam akumulasi/distribusi |
| **Teori Chan (缠论)** | 笔 (Bi), 线段 | Struktur yang dapat disesuaikan untuk identifikasi 笔 |
| **Fibonacci** | Titik Anchor | Titik swing tepat untuk retracement/extension |
| **Aksi Harga** | Struktur Swing | Visualisasi ritme pasar yang bersih |
**Satu indikator. Setiap metodologi. Fondasi yang kokoh.**
---
## Aplikasi Metodologi Perdagangan
### Smart Money Concepts (SMC) / ICT
- **Break of Structure (BOS)**: Ketika harga menembus swing tinggi/rendah, struktur bergeser
- **Change of Character (CHoCH)**: Break pertama yang berlawanan menandakan potensi pembalikan
- **Analisis Order Block**: Titik swing menentukan lokasi OB
- **Zona Premium/Diskon**: Gunakan rentang swing untuk perhitungan zona
**Tip**: Gunakan Left=5, Right=3 untuk struktur SMC intraday; Left=10, Right=5 untuk analisis timeframe lebih tinggi.
### Teori Gelombang Elliott
- **Pivot Gelombang**: Setiap fraktal menandai potensi awal/akhir gelombang
- **Gelombang Impuls**: Struktur 5 gelombang terlihat jelas melalui urutan swing
- **Gelombang Korektif**: Pola ABC muncul dari swing yang bergantian
- **Derajat Gelombang**: Sesuaikan bar Kiri/Kanan untuk melihat derajat gelombang yang berbeda
**Tip**: Jalankan beberapa instance — satu untuk gelombang minor (3/2), satu untuk menengah (10/5), satu untuk primer (20/10).
### Teori Dow
- **Konfirmasi Uptrend**: Serangkaian tinggi dan rendah yang lebih tinggi
- **Konfirmasi Downtrend**: Serangkaian tinggi dan rendah yang lebih rendah
- **Peringatan Pembalikan Tren**: Ketika urutan terputus
- **Tren Primer/Sekunder**: Pengaturan sensitivitas berbeda mengungkapkan level tren berbeda
**Tip**: Gunakan Left=10, Right=5 untuk tren primer; Left=5, Right=3 untuk tren sekunder/menengah.
### Metode Wyckoff
- **Fase Akumulasi**: Identifikasi swing rendah yang membentuk support
- **Fase Distribusi**: Identifikasi swing tinggi yang membentuk resistance
- **Springs & Upthrusts**: Swing ekstrem yang gagal dan berbalik
- **Analisis Rentang Perdagangan**: Batas jelas dari ekstrem swing
**Tip**: Gunakan sensitivitas lebih tinggi (Left=5, Right=3) untuk menangkap springs/upthrusts; sensitivitas lebih rendah (Left=10, Right=5) untuk menentukan batas rentang perdagangan.
### Teori Chan (缠论)
- **Identifikasi 笔 (Bi)**: Sesuaikan sensitivitas untuk mencocokkan definisi 笔 Anda
- **线段 (Segmen Garis)**: Sensitivitas lebih tinggi untuk struktur 线段
- **中枢 (Zhongshu)**: Rentang swing yang tumpang tindih menentukan zona konsolidasi
- **背驰 (Divergensi)**: Bandingkan magnitudo swing untuk analisis divergensi
### Support & Resistance — Aplikasi Paling Langsung
Ini adalah **kasus penggunaan paling sederhana namun paling kuat** — tidak memerlukan teori kompleks.
**Setiap fraktal adalah potensi level S/R:**
- **Fraktal Naik (Swing Tinggi)** = Level resistance di mana penjual masuk
- **Fraktal Turun (Swing Rendah)** = Level support di mana pembeli masuk
- **Diuji Berkali-kali** = Level yang lebih kuat dan signifikan
- **Level yang Terbuka** = Resistance lama menjadi support baru (dan sebaliknya)
**Penggunaan Praktis:**
- Gambar garis horizontal dari titik fraktal untuk memperpanjang S/R ke masa depan
- Amati reaksi harga pada level ini
- Gabungkan dengan analisis volume untuk konfirmasi
- Gunakan untuk penempatan stop-loss (di bawah support / di atas resistance)
- Identifikasi peluang breakout/breakdown
**Tip**: Nilai Left/Right yang lebih tinggi (misalnya, 10/5 atau 20/10) menghasilkan level S/R yang lebih sedikit tetapi lebih signifikan. Nilai yang lebih rendah menunjukkan level yang lebih rinci untuk scalping.
### Analisis Fibonacci
Fraktal menyediakan **titik jangkar** untuk pengukuran Fibonacci — tidak perlu lagi menebak dari mana harus menggambar.
**Retracement:**
- Swing Tinggi ke Swing Rendah untuk retracement downtrend
- Swing Rendah ke Swing Tinggi untuk retracement uptrend
- Level kunci: 38,2%, 50%, 61,8%
**Ekstensi:**
- Gunakan tiga fraktal berturut-turut (A-B-C) untuk proyeksi ekstensi
- Level target: 127,2%, 161,8%, 261,8%
**Alur Kerja Praktis:**
1. Identifikasi dua fraktal signifikan (satu tinggi, satu rendah)
2. Gambar alat Fibonacci dari satu ke yang lain
3. Amati reaksi harga pada level Fib
4. Gabungkan dengan fraktal lain untuk konfluensi
**Tip**: Gunakan nilai Left/Right yang lebih tinggi (10/5 atau lebih) untuk mengidentifikasi swing utama untuk analisis Fibonacci. Swing minor menghasilkan terlalu banyak level.
---
## Panduan Memulai Cepat
**Langkah 1: Tambahkan ke Grafik**
- Temukan SmartFractalZigZag di Indikator
- Seret ke grafik Anda
**Langkah 2: Pilih Gaya Anda**
| Gaya Anda | Bar Kiri | Bar Kanan | Apa yang Akan Anda Lihat |
|------------|-----------|------------|-----------------|
| Scalper | 3 | 2 | Banyak swing kecil |
| Day Trader | 5 | 3 | Struktur intraday |
| Swing Trader | 10 | 5 | Swing utama (default) |
| Position Trader | 20 | 10 | Struktur makro saja |
**Langkah 3: Interpretasi Sinyal**
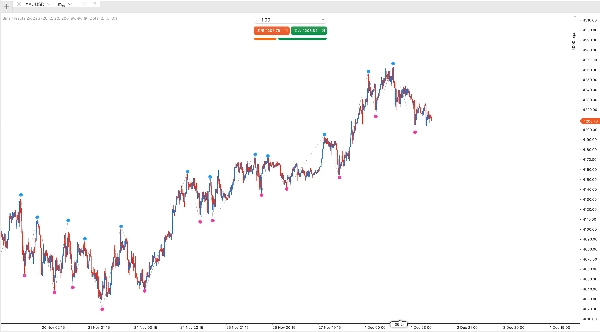
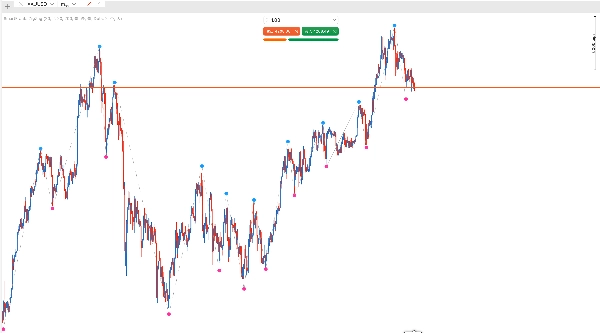
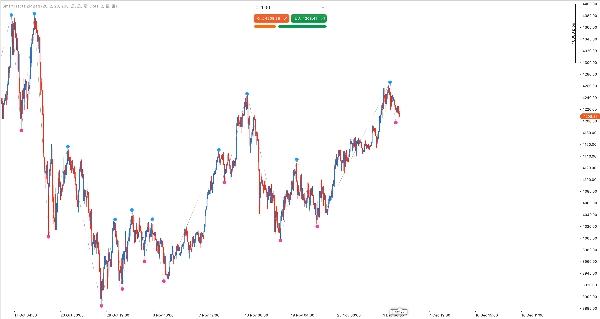
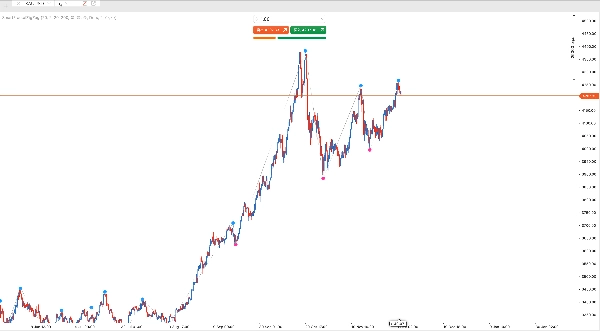
- **Titik biru di atas lilin** = Swing Tinggi (potensi resistance)
- **Titik merah muda di bawah lilin** = Swing Rendah (potensi support)
- **Garis ZigZag** = Koneksi visual dari swing
**Langkah 4: Terapkan ke Perdagangan Anda**
- **Perdagangan S/R**: Gambar garis horizontal dari titik fraktal
- **Perdagangan Tren**: Cari tinggi/rendah yang lebih tinggi (uptrend) atau tinggi/rendah yang lebih rendah (downtrend)
- **Fibonacci**: Gunakan fraktal sebagai titik jangkar untuk alat retracement/extension
- **Pengenalan Pola**: Temukan double tops, head & shoulders, dll.
**Tips Profesional:**
- Jalankan beberapa instance dengan pengaturan berbeda untuk melihat struktur mikro dan makro
- Matikan ZigZag jika Anda hanya membutuhkan titik fraktal
- Sesuaikan Offset Fraktal jika titik bertumpuk dengan lilin
---
## Fitur Utama
### 1. TANPA REPAINTING — Fitur yang Tidak Bisa Ditawar
**Ini adalah fitur paling penting.**
90% indikator fraktal/ZigZag melakukan repaint. Sinyal muncul, hilang, dan bergerak. Backtest Anda menunjukkan entri "sempurna" yang tidak pernah ada secara real-time.
**Jaminan SmartFractalZigZag:**
- Fraktal dikonfirmasi HANYA setelah semua bar sisi kanan telah ditutup
- Setelah digambar, fraktal TIDAK PERNAH berubah posisi
- Sinyal historis 100% dapat diandalkan
- Hasil backtest = hasil perdagangan langsung
- Aman untuk integrasi perdagangan otomatis/cBot
**Prinsip Teknis**: Fraktal pada bar N dikonfirmasi hanya ketika bar N+RightBars telah sepenuhnya ditutup. Tidak ada pengecualian.
### 2. Sensitivitas Struktur yang Dapat Disesuaikan
**Bar Kiri/Kanan** mengontrol seberapa "signifikan" sebuah swing harus:
| Gaya Perdagangan | Pengaturan yang Disarankan | Kasus Penggunaan |
|---------------|-------------------|----------|
| Scalping | Left=3, Right=2 | Mikro-struktur, pembalikan cepat |
| Perdagangan Harian | Left=5, Right=3 | Swing intraday |
| Perdagangan Swing | Left=10, Right=5 | Struktur multi-hari |
| Perdagangan Posisi | Left=20, Right=10 | Struktur pasar utama |
**Kekuatan Multi-Instance**: Jalankan 2-3 instance dengan pengaturan berbeda untuk melihat struktur mikro, meso, dan makro secara bersamaan dalam satu grafik.
### 3. Penyaringan Arah Sama yang Cerdas — Hilangkan Kebisingan & Sinyal Palsu
Ini adalah **fitur penting** yang membedakan SmartFractalZigZag dari indikator fraktal biasa.
**Masalah dengan Fraktal Tradisional:**
Indikator fraktal tradisional menunjukkan SETIAP titik fraktal yang memenuhi syarat. Dalam pasar tren, ini menciptakan:
- Banyak fraktal berurutan dengan arah yang sama (misalnya, 5 fraktal naik berturut-turut selama uptrend)
- Kekacauan visual yang mengaburkan struktur pasar yang sebenarnya
- Sinyal palsu — tidak setiap fraktal adalah titik pembalikan yang bermakna
- Garis ZigZag yang melompat-lompat secara tidak menentu antara swing minor
- Kesulitan mengidentifikasi level support/resistance yang asli
**Solusi SmartFractalZigZag — Penyaringan Ekstrem Interval:**
Indikator secara cerdas menyaring fraktal dengan arah yang sama, hanya menyimpan ekstrem SEBENARNYA:
- **Fraktal Naik**: Hanya swing tertinggi di antara fraktal naik berurutan yang disimpan
- **Fraktal Turun**: Hanya swing terendah di antara fraktal turun berurutan yang disimpan
- **Alternasi Ketat**: Setiap fraktal naik diikuti oleh fraktal turun, dan sebaliknya
- **Jaminan Ekstrem Interval**: Setiap fraktal yang disimpan mewakili ekstrem sebenarnya antara dua fraktal berarah berlawanan
**Mengapa Ini Penting:**
| Tanpa Penyaringan | Dengan Penyaringan Cerdas |
|-------------------|---------------------|
| Banyak titik, kekacauan visual | Titik bersih dan minimal |
| Setiap swing minor ditampilkan | Hanya swing signifikan |
| Level S/R palsu | Level S/R dapat diandalkan |
| Garis ZigZag berisik | ZigZag halus dan bermakna |
| Sulit mengidentifikasi struktur | Struktur terlihat sekilas |
**Manfaat Perdagangan:**
1. **Grafik Lebih Bersih**: Fokus pada yang penting, bukan kebisingan
2. **S/R Dapat Diandalkan**: Setiap fraktal adalah ekstrem asli, bukan fluktuasi minor
3. **Penghitungan Gelombang Lebih Baik**: Pivot jelas untuk analisis Gelombang Elliott
4. **BOS/CHoCH Akurat**: Break struktur asli, bukan sinyal palsu
5. **Fibonacci Terpercaya**: Titik jangkar yang mewakili swing nyata
**Fleksibilitas**: Jika Anda ingin melihat SEMUA fraktal (untuk kebutuhan analisis spesifik), cukup matikan Filter Consecutive. Namun bagi sebagian besar trader, tampilan yang disaring memberikan sinyal yang lebih bersih dan dapat ditindaklanjuti.
**Hasil**: Titik lebih sedikit, swing lebih jelas, level dapat dipercaya, dan struktur pasar asli.
### 4. Integrasi Fraktal + ZigZag
- **Titik Fraktal**: Tandai swing tinggi dan rendah yang tepat
- **Garis ZigZag**: Hubungkan swing untuk aliran visual
- **Tampilan Offset**: Fraktal mengambang di atas/bawah lilin tanpa menghalangi harga
- **Toggle Independen**: Tampilkan hanya fraktal, hanya ZigZag, atau keduanya
---
## Parameter
### Pengaturan Fraktal
- **Bar Kiri**: Jumlah bar di kiri untuk perbandingan (default: 10)
- **Bar Kanan**: Jumlah bar di kanan untuk konfirmasi (default: 5)
### Pengaturan Tampilan
- **Ukuran Fraktal**: Ukuran titik fraktal (default: 20, rentang: 5-60)
- **Offset Fraktal**: Jarak dari harga dalam poin (default: 50)
- **Warna Fraktal Naik/Turun**: Warna yang dapat disesuaikan
- **Tampilkan Fraktal**: Toggle tampilan fraktal
### Pengaturan ZigZag
- **Aktifkan ZigZag**: Toggle garis ZigZag
- **Warna/Gaya/Ketebalan ZigZag**: Kustomisasi penuh
### Pengaturan Filter
- **Filter Consecutive**: Penyaringan arah sama yang cerdas (default: AKTIF)
### Pengaturan Lainnya
- **Paksa Bersihkan Semua Instance**: Bersihkan semua objek indikator di grafik
---
## Mengapa Memilih SmartFractalZigZag?
1. **Agnostik Metodologi**: Bekerja dengan SMC, Elliott, Dow, Wyckoff, Teori Chan, dan lainnya
2. **Tanpa Repainting**: Bangun analisis Anda berdasarkan kebenaran, bukan fiksi
3. **Sensitivitas yang Dapat Disesuaikan**: Sesuaikan indikator dengan gaya perdagangan ANDA
4. **Dukungan Multi-Instance**: Lihat beberapa level struktur secara bersamaan
5. **Output Bersih**: Penyaringan cerdas menghilangkan kebisingan, hanya menampilkan yang penting
6. **Kualitas Profesional**: Kode kuat dengan penanganan kasus tepi yang komprehensif
7. **Siap Otomatisasi**: Sinyal dapat diandalkan untuk integrasi cBot
---
### Klarifikasi: Penyaringan Arah Sama dan Penggantian Visual
- Penyaringan arah sama yang cerdas hanya menyimpan titik paling ekstrem di antara kandidat berurutan dengan arah yang sama (tinggi lebih tinggi untuk naik, rendah lebih rendah untuk turun).
- Sampai fraktal dengan arah berlawanan muncul, titik arah sama yang sebelumnya digambar mungkin secara visual digantikan oleh yang lebih ekstrem. Ini adalah penyaringan yang disengaja, bukan kebocoran data masa depan, dan hanya menggunakan bar yang telah sepenuhnya ditutup.
- Ingin benar-benar tanpa penggantian visual? Matikan Filter Consecutive untuk menampilkan setiap fraktal yang memenuhi syarat (lebih banyak titik, lebih banyak kebisingan).
Ringkasan
Key features include zero repainting—fractals confirm only after a set number of bars close, ensuring signals do not change retrospectively—and customizable sensitivity through adjustable left and right bar parameters to match different trading styles from scalping to position trading. The indicator employs smart same-direction filtering to reduce noise by preserving only the most extreme fractal in consecutive swings, resulting in cleaner charts and more reliable support/resistance levels.
SmartFractalZigZag integrates fractal points with ZigZag lines for visual clarity, with options to toggle each independently. It facilitates applications such as break of structure (BOS), change of character (CHoCH), order block analysis, Fibonacci retracement and extension anchoring, and pattern recognition. Multiple instances can run simultaneously to display micro to macro market structures. The indicator is suitable for markets including Forex, indices, commodities, stocks, and cryptocurrencies.