Описание
Краткое описание
Карта режимов тренда и объема — это фильтр режимов для cTrader, который измеряет направление и устойчивость как цены, так и объема. Он дает вам нормализованный балл тренда и балл тренда объема в диапазоне –10 до +10, окрашивает ваши свечи плавным градиентом от медвежьего красного до бычьего зеленого и показывает, является ли текущая среда рискованной, безопасной или просто шумной.
🧠 Что он делает
Этот индикатор повторяет логику “Regime Filter” от BigBeluga на TradingView, адаптированную для cTrader и оформленную в понятную карту режимов тренда и объема.
Сглаженные цена и объем
- Вычисляет HLC3 (среднее от High, Low, Close) и применяет скользящую среднюю Халла (HMA) для сглаживания цены.
- Применяет другую скользящую среднюю Халла к объему тиков.
Баллы тренда (цена)
- За последние N баров (
Length) сравнивает текущий HMA цены с каждым прошлым значением HMA:
- Если текущий HMA > прошлый HMA → тренд +1
- Если текущий HMA ≤ прошлый HMA → тренд –1
- Накопленный балл масштабируется до –10 … +10 → это значение тренда.
Баллы тренда объема
- Использует ту же логику, но применительно к HMA объема.
- Результат — еще один нормализованный балл в –10 … +10 → это значение объема.
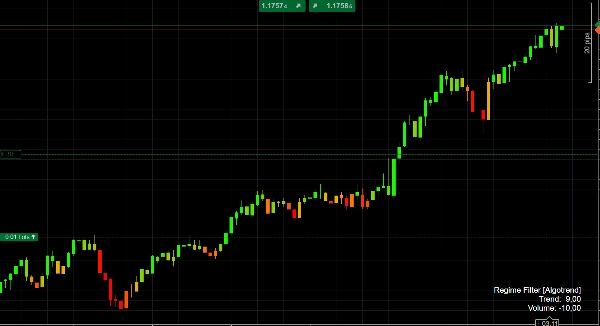
Логика цвета
- Когда балл тренда отрицательный, свечи окрашиваются градиентом красный → оранжевый в зависимости от силы нисходящего режима.
- Когда балл тренда положительный, свечи окрашиваются оранжевый → лаймовый, с более ярким зеленым для более сильных восходящих режимов.
Это дает вам мгновенный визуальный сигнал о том, является ли ценовое движение медвежьим, нейтральным или бычьим и насколько устойчив этот режим в данный момент.
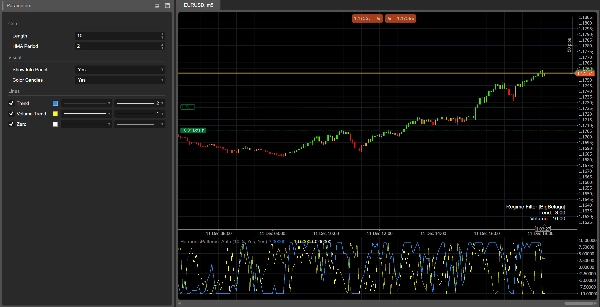
Панель режима
В дополнительном окне индикатор отображает:
- Линию тренда (синяя)
- Линию тренда объема (серая)
- Нулевую линию (базовая линия)
На последнем баре выводится небольшой информационный панель с текущими значениями Тренда и Объема.
🎯 Как вы можете использовать это
Подтверждение тренда
- Торгуйте только в направлении сильного режима, например:
- Тренд > +4 → преимущественно длинные позиции
- Тренд < –4 → преимущественно короткие позиции
Фильтр режимов
- Отключайте или снижайте масштаб вашей стратегии, когда режим слабый (Тренд около 0) или когда тренд объема сильно отрицательный, что часто сигнализирует о флуктуациях или затухающем движении.
Контекст для сигналов
Комбинируйте ваши существующие сигналы входа (ценовое действие, гармонические паттерны, осцилляторы и т.д.) с Картой режимов тренда и объема в качестве макрофильтра:
- Принимайте только пробои, когда Тренд положительный и тренд объема также положительный.
- Избегайте сценариев возврата к среднему, когда Тренд очень сильный (> +8 или < –8), так как рынок находится в мощном направленном режиме.
⚙️ Входные параметры
Основные
Length
Количество баров, используемых для построения баллов тренда и объема.
- Большие значения → более плавный, “макро” режим; медленнее меняется, но стабильнее.
- Малые значения → более быстрая реакция, но больше шума и частых смен.
Период HMA
Период скользящей средней Халла, используемой для сглаживания как цены, так и объема.
- Настройте его в соответствии с вашим таймфреймом и стилем торговли: короче для низких таймфреймов, длиннее для высоких.
Визуальные
Показывать информационную панель
Показывает/скрывает небольшой текстовый панель на последнем баре с текущими баллами Тренда и Объема.Окрашивать свечи
Включает окрашивание свечей на основе значения Тренда (градиент красный / оранжевый / зеленый). Выключите, если предпочитаете использовать стандартные цвета графика.
✅ Шпаргалка по интерпретации
- Тренд ≥ +7 → сильный бычий режим, свечи ярко-зеленые.
- Тренд между +3 и +7 → бычий уклон; откаты — потенциальные зоны для покупки на спаде.
- Тренд между –3 и +3 → боковой / шумный рынок; сигналы менее надежны.
- Тренд ≤ –7 → сильный медвежий режим, свечи темно-красные.
- Тренд объема > 0 → растущая / устойчивая активность, движения скорее “реальные” и устойчивые.
- Тренд объема < 0 → снижающееся участие, повышенный риск ложных движений, флуктуаций или разворотов.
Сводка
Отзывы покупателей
5 | 0 % | |
4 | 100 % | |
3 | 0 % | |
2 | 0 % | |
1 | 0 % |


