Описание
📊 Индикатор Fib Volume Delta (БЕСПЛАТНО)
Фибоначчи, проекция и реальный дельта-объем для cTrader
🆓 Индикатор Fib Volume Delta — это бесплатный профессиональный индикатор для cTrader, предназначенный для помощи трейдерам в анализе уровней Фибоначчи, структуры рынка и реального дельта-объема в чистом и интуитивно понятном виде.
Этот индикатор является основой Fib Volume Delta Bot, предоставляя ту же логику в ручной, визуальной форме.
📌 Для индикатора (ручной анализ)
Уведомление о связанном инструменте
Этот индикатор является аналитической основой Fib Volume Delta Bot — автоматизированного торгового решения, построенного на той же логике Фибоначчи и дельта-объема.Хотя индикатор предназначен для ручного анализа и поддержки принятия решений, cBot преобразует эту логику в полностью автоматизированную стратегию с расширенным управлением рисками и сделками. https://ctrader.com/it/products//3006/?u=Labot
🔍 ЧТО ДЕЛАЕТ ИНДИКАТОР
Индикатор автоматически:
✅ Обнаруживает максимумы и минимумы колебаний
✅ Рисует ключевые уровни Фибоначчи
✅ Вычисляет реальный дельта-объем (объем тиков быков против медведей)
✅ Проецирует потенциальные ценовые цели с помощью проекции Фибоначчи
✅ Работает на Forex, криптовалютах, индексах
Без перерисовки.
Без симулированного объема.
Без загромождения.
🧮 ОСНОВНЫЕ ФУНКЦИИ
📐 Структура Фибоначчи
- Автоматическое определение текущего ценового диапазона
- Динамическое построение уровней Фибоначчи:
-
- 23.6%
- 38.2%
- 50.0%
- 61.8%
- 78.6%
- Бычья или медвежья логика на основе порядка колебаний
🔮 Проекция Фибоначчи
- Опциональная линия проекции для оценки будущих ценовых целей
- Использует тот же диапазон колебаний
- Идеально подходит для:
-
- планирования тейк-профита
- оценки риска/вознаграждения
- анализа сценариев
📊 Реальный дельта-объем
- Вычисляет объем тиков быков против медведей
- Отображает:
-
- Объем быков
- Объем медведей
- Дельта (Быки − Медведи)
- Помогает выявлять:
-
- поглощение
- дивергенцию
- силу или слабость движений
⚠️ Использует реальный объем тиков, а не симулированные данные.
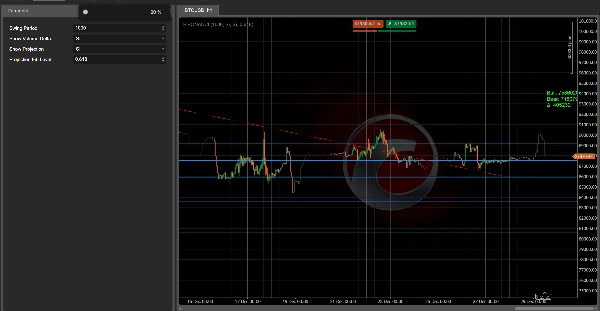
⚙️ ОБЪЯСНЕНИЕ ПАРАМЕТРОВ
🧭 Обнаружение колебаний
- 🔢 Период колебаний
-
- Количество баров, используемых для определения максимумов и минимумов колебаний
- Большее значение = более стабильная структура
- Меньшее значение = более реактивная структура
📊 Дельта объема
- 👁 Показать дельту объема
-
- Включить / отключить текст дельты объема на графике
🔮 Проекция
- 📈 Показать проекцию
-
- Включить / отключить проекцию Фибоначчи
- 📐 Уровень проекции Фибоначчи
🧠 КАК ИСПОЛЬЗОВАТЬ
✔ Определяйте ключевые зоны отката
✔ Подтверждайте входы с помощью дельты объема
✔ Проецируйте реалистичные цели
✔ Сочетайте с ценовым действием или фильтрами тренда
✔ Идеально подходит для ручной торговли или полуавтоматизированных рабочих процессов
🤖 РАБОЧИЙ ПРОЦЕСС ИНДИКАТОРА + БОТА
Этот индикатор является визуальной и аналитической основой Fib Volume Delta Bot:
- 📊 Индикатор → анализ и подтверждение
- ⚙️ cBot → исполнение, управление рисками и автоматизация
Вы можете:
- использовать индикатор отдельно (ручная торговля)
- или сочетать его с cBot для полной автоматизации
🆓 БЕСПЛАТНО И ПРОЗРАЧНО
✔ Полностью БЕСПЛАТНО
✔ Без заблокированных функций
✔ Без внешних зависимостей
✔ Разработано для профессиональных трейдеров
⚠️ ОТКАЗ ОТ ОТВЕТСТВЕННОСТИ
Этот индикатор сам по себе не генерирует сигналы.
Это инструмент поддержки принятия решений, предназначенный для использования с правильным управлением рисками и учетом рыночного контекста.
Сводка
Key features include dynamic Fibonacci level drawing based on current price ranges, real tick volume data (not simulated), and a clean, non-repainting interface. Users can customize swing detection sensitivity, toggle volume delta display, and enable or disable projection lines with selectable Fibonacci extension levels.
This indicator serves as the analytical foundation for the Fib Volume Delta Bot, an automated trading solution that applies the same logic for trade execution and risk management. It is intended as a decision-support tool to identify retracement zones, confirm entries with volume delta, and project realistic targets, suitable for manual or semi-automated trading workflows.


