Описание
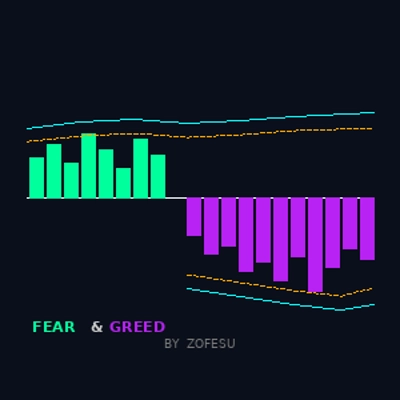
📊 Fear & Greed от Zofesu — Двойной VIX движок | Обнаружение институционального сентимента
Fear & Greed — это точный осциллятор, построенный на двойном движке Williams VIX Fix — один настроен на панику (Fear), другой на эйфорию (Greed). Он выявляет моменты, когда институциональное перегревание достигает статистически экстремальных уровней, сигнализируя о зонах с высокой вероятностью разворота.
⚙ КАК ЭТО РАБОТАЕТ
Индикатор выполняет два независимых расчёта WVF:
Движок страха — измеряет, насколько текущий минимум удалён от самого высокого недавнего закрытия. Всплески сигнализируют о капитуляции и панике.
Движок жадности — измеряет, насколько текущий максимум удалён от самого низкого недавнего минимума. Всплески сигнализируют о эйфорическом переусердствовании.
Каждый движок фильтруется через два независимых порога:
1. Верхняя/нижняя граница полос Боллинджера (2× StdDev)
2. Порог перцентильного ранга (настраиваемый)
Гистограмма появляется ТОЛЬКО когда цена пересекает ОБА или ЛЮБОЙ из порогов — устраняя шум и показывая только статистически значимые экстремумы.
🔑КЛЮЧЕВЫЕ ОСОБЕННОСТИ
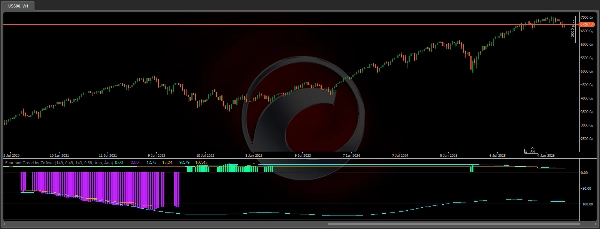
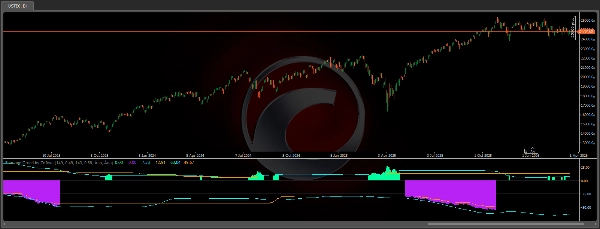
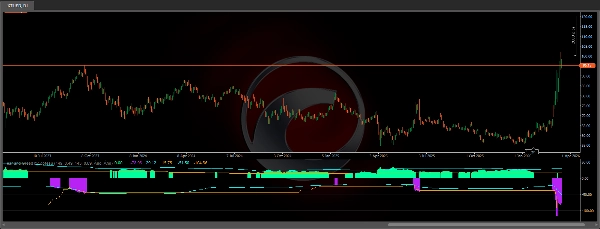
✅ Двойной движок WVF — Fear (лайм) и Greed (фиолетовый) рассчитываются независимо с отдельными окнами просмотра
✅ Полосы BB — динамические границы полос Боллинджера для каждого движка
✅ Линии перцентилей — настраиваемые пороги перцентильного ранга
✅ Чистый вывод гистограммы — бары видны только при экстремальных значениях
✅ Все 4 линии границ можно включать/выключать независимо
✅ Полностью настраиваемый — отдельные параметры окна просмотра и перцентиля для Fear и Greed
✅ Работает на всех активах и таймфреймах
✅ Лёгкий C# — без влияния на производительность
📚КАК ИСПОЛЬЗОВАТЬ
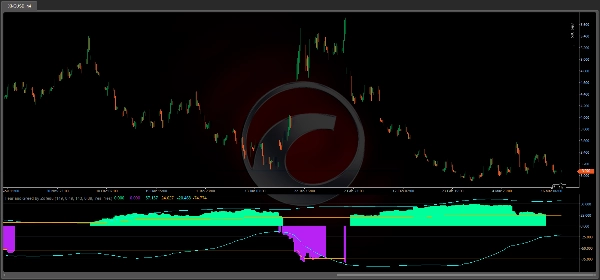
1. Добавьте индикатор на любой график как отдельную панель
2. Лайм гистограмма = всплеск страха — потенциальная зона бычьего разворота
3. Фиолетовая гистограмма = всплеск жадности — потенциальная зона медвежьего разворота
4. Аква линии = границы BB для каждого движка
5. Оранжевые пунктирные линии = пороги перцентилей
6. Используйте в сочетании с ценовым действием, уровнями поддержки/сопротивления, SuperTrend или VWAP
7. Более высокие таймфреймы (D1, W1) дают самые надёжные сигналы Лучшие результаты на: H1, H4, D1 Работает на: Индексы (NAS100, SPX500), Крипто (BTCUSD), Форекс, Золото, Нефть, Акции.
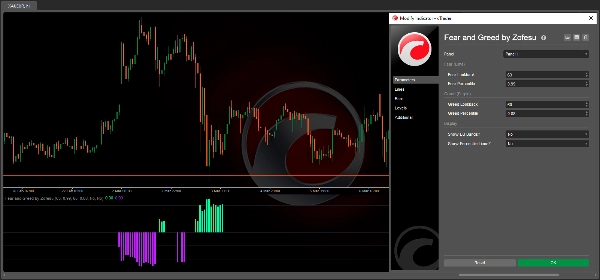
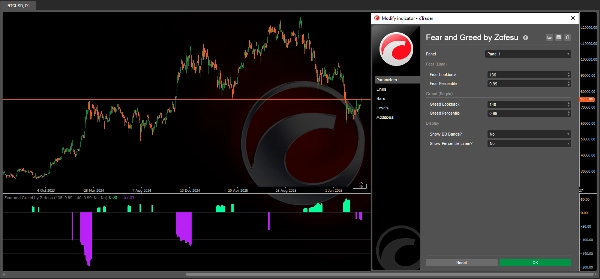
🔗ПАРАМЕТРЫ
Fear (лайм):
- Период просмотра Fear — бары для расчёта WVF и BB (по умолчанию 149)
- Перцентиль страха — порог перцентильного ранга (по умолчанию 0,49)
Greed (фиолетовый):
- Период просмотра Greed — бары для расчёта WVF и BB (по умолчанию 143)
- Перцентиль жадности — порог перцентильного ранга (по умолчанию 0,89)
Отображение:
- Показывать полосы BB — включать/выключать аква линии границ
- Показывать линии перцентилей — включать/выключать оранжевые линии порогов
🎯 РУКОВОДСТВО ПО КАЛИБРОВКЕ (ИЗ ОПЫТА)
Каждый актив и таймфрейм требует своих уникальных настроек — индикатор создан для обеспечения этой гибкости.
Шаг 1 — Найдите подходящий период просмотра:
Сначала установите перцентиль на 0,99, затем экспериментируйте со значением периода просмотра от 10 до 1000.
Больший период просмотра уменьшает шум, но может скрывать действительные сигналы. Рекомендуемый диапазон — 50–500 для большинства настроек.
Шаг 2 — Тонкая настройка перцентиля:
Когда найдёте подходящий период просмотра, постепенно уменьшайте перцентиль с 0,99 вниз. Это ослабляет фильтр и выявляет дополнительные сигналы. Параметры Fear и Greed не обязательно должны совпадать.
Шаг 3 — Интерпретация сигналов:
- Бар страха исчезает на закрытой свече → потенциальный вход в лонг на следующей свече.
- Бар жадности исчезает на закрытой свече → потенциальный вход в шорт на следующей свече.
- Fear или Greed горят несколько баров подряд = рынок в тренде или накапливает позиции — не обязательно разворот.
- Одновременное горение Fear и Greed = конфликтующее давление. Сначала проверьте более высокий таймфрейм. Есть ли рядом ключевой уровень поддержки/сопротивления? Если да, дождитесь подтверждения перед входом.
Количество сигналов полностью зависит от вас и вашей стратегии — более строгие настройки дают меньше, но более качественных входов. После правильной настройки вы можете отключить линии в настройках, чтобы они не мешали.
⚠️ ОТКАЗ ОТ ОТВЕТСТВЕННОСТИ Торговля финансовыми инструментами связана с существенным риском потерь. Прошлая доходность любого индикатора или стратегии не гарантирует будущих результатов. Этот инструмент предоставляется только для информационных и образовательных целей. Всегда используйте надлежащее управление рисками и никогда не рискуйте больше, чем можете позволить себе потерять. Автор не несёт ответственности за любые торговые убытки, понесённые при использовании этого индикатора.
Сводка
Отзывы покупателей
5 | 0 % | |
4 | 100 % | |
3 | 0 % | |
2 | 0 % | |
1 | 0 % |


