Описание
━━━━━━━━━━━━━━━━━━━━━━━━━━━━━━━━━━━━━━━━
ATR Risk Visualizer — Риск
━━━━━━━━━━━━━━━━━━━━━━━━━━━━━━━━━━━━━━━━
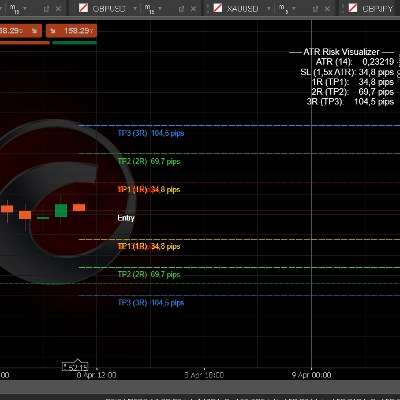
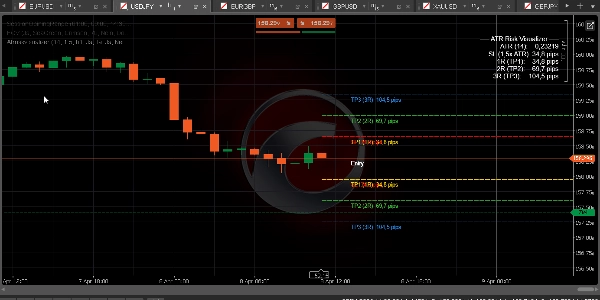
Мгновенно визуализирует ваши уровни Stop Loss и Take Profit на основе ATR — с полной картой R-мультипликаторов (от 1R до 5R) и метками в пипсах — чтобы вы всегда торговали с определённым риском перед входом в позицию.
─────────────────────────────
КЛЮЧЕВЫЕ ОСОБЕННОСТИ
► Stop Loss на основе ATR — расстояние SL рассчитывается как ATR × настраиваемый множитель (по умолчанию 1.5×)
► R-мультипликаторы Take Profit — TP1 (1R), TP2 (2R), TP3 (3R), TP4 (4R), TP5 (5R) автоматически строятся от текущей цены
► Метки в пипсах на каждом уровне — сразу видна точная дистанция в пипсах для SL и каждого TP
► Одновременные уровни Long и Short — или переключение в режим только Long или только Short
► Селектор таймфрейма ATR — вычисление ATR с более высокого таймфрейма (например, H1 ATR на графике M15)
► Панель информации ATR (вверху справа) — показывает значение ATR, размер SL и TP1/2/3 в пипсах
► Полный контроль цвета — отдельные цвета для SL, TP1, TP2, TP3, TP4/5 через встроенные цветовые селекторы cTrader
► Настраиваемый стиль линии (Сплошная / Штрихи / Точки) и толщина
► Цена Ask или Bid как ориентир входа — выбирайте в зависимости от направления вашей сделки
─────────────────────────────
НАСТРОЙКИ ПО УМОЛЧАНИЮ
→ Период ATR 14
→ Множитель ATR 1.5× (SL = 1.5 × ATR)
→ Таймфрейм ATR H1
→ Показать TP1/2/3 ВКЛ
→ Показать TP4/5 ВЫКЛ
→ Направление Оба (Long + Short)
→ Цвет SL Красный
→ Цвет TP1 Золотой
→ Цвет TP2 LimeGreen
→ Цвет TP3 DodgerBlue
→ Стиль линии Штрихи
─────────────────────────────
КАК ИСПОЛЬЗОВАТЬ
1. Добавьте индикатор на любой график
2. Установите период ATR и множитель в соответствии с вашей стратегией (1.5× ATR — стандарт для Forex/Gold)
3. Установите таймфрейм ATR на H1 или H4 для более плавного расчёта размера SL
4. Считайте значения пипсов непосредственно с меток на графике
5. Используйте TP1 (1R) для первой частичной фиксации, TP2 (2R) для безубыточности, TP3 (3R) для полного тейк-профита
6. Комбинируйте с индикаторами BOS/CHoCH и FVG для полного рабочего процесса входа по SMC
─────────────────────────────
ИДЕАЛЬНО ДЛЯ
✔ Трейдеров FTMO и проп-фирм, которым необходимо точно рассчитывать риск
✔ Трейдеров SMC и ICT, использующих R-мультипликаторы для управления сделками
✔ Трейдеров Forex, Gold и Индексов на любых таймфреймах
✔ Трейдеров, желающих иметь чёткую визуальную карту риска перед каждым входом
✔ Всех, кто строит системный подход к размеру позиций
─────────────────────────────
СОВМЕСТИМОСТЬ
→ Платформа cTrader (Desktop & Web)
→ Классы активов Forex, Индексы, Товары, Крипто CFD
→ Таймфреймы Все (M1 до MN)
→ Права доступа Не требуются
→ Тип счёта Live & Demo
━━━━━━━━━━━━━━━━━━━━━━━━━━━━━━━━━━━━━━━━
Сводка
Отзывы покупателей
5 | 50 % | |
4 | 50 % | |
3 | 0 % | |
2 | 0 % | |
1 | 0 % |