
Описание
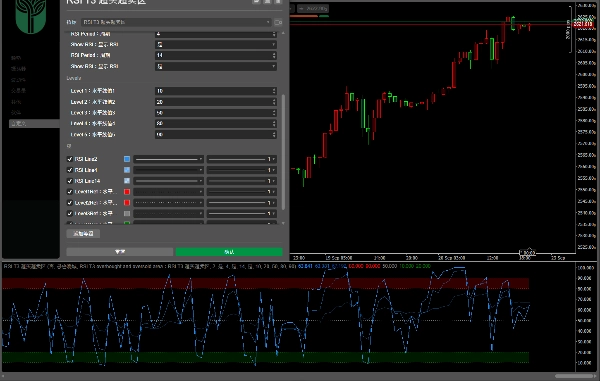
Трёхпараметрический RSI с зонами перекупленности/перепроданности
(Параметры и зоны перекупленности/перепроданности можно настраивать независимо; каждую линию цикла можно включать или отключать отдельно), что облегчает наблюдение за мультициклическим резонансом:
• Согласованность тренда:
RSI короткого, среднего и длинного циклов движется в одном направлении. Если RSI короткого цикла находится выше RSI среднего и длинного циклов, это указывает на бычий тренд; в противном случае — на медвежий тренд.
• Дивергенция и разворот:
Когда цена достигает нового максимума/минимума, но RSI короткого цикла не следует за этим, а RSI среднего и длинного циклов ослабевает/восстанавливается, это сигнализирует о возможной коррекции/отскоке.
• Подтверждение перекупленности/перепроданности:
Когда RSI одного цикла входит в зону перекупленности или перепроданности, следует учитывать данные других циклов; если несколько циклов одновременно входят в эти зоны, сигнал становится более надёжным.
• Резонанс циклов:
Когда RSI нескольких циклов посылает одинаковый сигнал (например, все пробивают среднюю линию 50), вероятность продолжения или разворота тренда выше, что может помочь в принятии решений.
带超买超卖区域的三参数 RSI
(可自主调整参数与超买超卖区域,支持单独开关各周期线),便于观察多周期共振:
•趋势一致性:
短、中、长周期 RSI 同向运行,短周期在中长周期上方为多头趋势;反之则为空头趋势。
•背离与反转:
价格创新高 / 低但短周期 RSI 未同步,且中长周期 RSI 走弱 / 回升,提示可能回调 / 反弹。
•超买超卖确认:
单周期超买超卖时,需结合其他周期判断;多周期同时超买超卖,信号更可靠。
•周期共振:
多周期 RSI 同发信号(如均突破 50 中轴线),趋势延续或反转的概率更高,可辅助决策。
Сводка
- Trend Consistency: Identifies bullish or bearish trends based on the relative positions of short-, medium-, and long-cycle RSIs.
- Divergence and Reversal Signals: Detects potential pullbacks or rallies when price movements diverge from short-cycle RSI behavior while medium- and long-cycle RSIs weaken or recover.
- Overbought/Oversold Confirmation: Enhances signal reliability by combining overbought or oversold conditions across multiple RSI cycles.
- Cycle Resonance: Highlights stronger trend continuation or reversal probabilities when multiple RSI cycles simultaneously signal, such as crossing the 50 midline.
This indicator supports detailed momentum analysis by integrating multi-timeframe RSI data, aiding traders in decision-making through comprehensive trend and reversal insights.
Отзывы покупателей
5 | 0 % | |
4 | 100 % | |
3 | 0 % | |
2 | 0 % | |
1 | 0 % |


![Логотип продукта "[Hamster-Coder] Pivot Points MTF"](https://cdn.ctrader.com/image/webp/4c143e5a-309c-40e3-a578-f04d1e133ffa_31159)


