Deskripsi
PEMINDAI ZONA KONSOLIDASI NILAI TINGGI
Deteksi Konsolidasi Cerdas dengan Visualisasi Heatmap
--------------------------------------------------
Temukan zona konsolidasi dengan probabilitas tinggi. Lihat di mana harga benar-benar diperdagangkan.
--------------------------------------------------
APA YANG DILAKUKAN INDIKATOR INI
Sebagian besar pemindai konsolidasi hanya menggambar kotak di sekitar rentang harga. Indikator ini melangkah lebih jauh dengan menganalisis kualitas setiap sentuhan — membedakan antara body-in-zone (partisipasi kuat) dan wick-only (partisipasi lemah).
Hasilnya adalah heatmap yang menunjukkan dengan tepat di mana harga menghabiskan waktu paling banyak dalam setiap zona, membantu Anda mengidentifikasi level paling andal untuk entri, keluar, dan penempatan stop.
--------------------------------------------------
LOGIKA INTI DAN PERHITUNGAN
Indikator memindai aksi harga terbaru untuk rentang candle yang tumpang tindih. Ketika sejumlah candle yang cukup tumpang tindih secara konsisten, zona konsolidasi terdeteksi. Jumlah minimum candle berturut-turut yang diperlukan dapat dikonfigurasi, begitu juga jumlah maksimum candle yang tidak setuju yang diizinkan dalam urutan tersebut.
Untuk setiap zona, indikator melacak berapa banyak candle yang memiliki body di dalam zona dibandingkan dengan berapa banyak yang hanya menyentuh zona dengan wick mereka. Candle body-in-zone menunjukkan partisipasi kuat, sementara candle wick-only menunjukkan minat yang lebih lemah. Perbedaan ini membentuk dasar dari skor kekuatan.
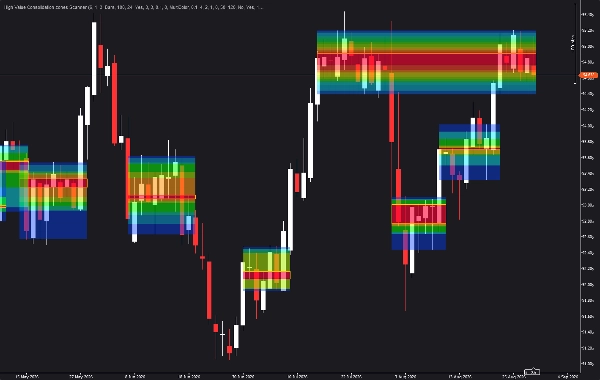
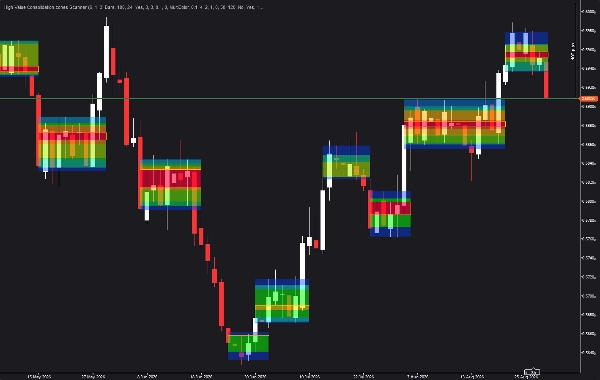
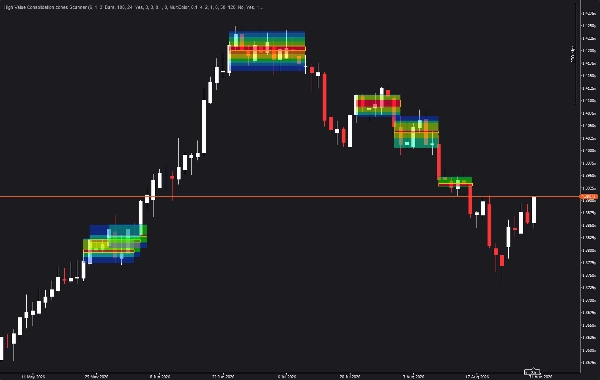
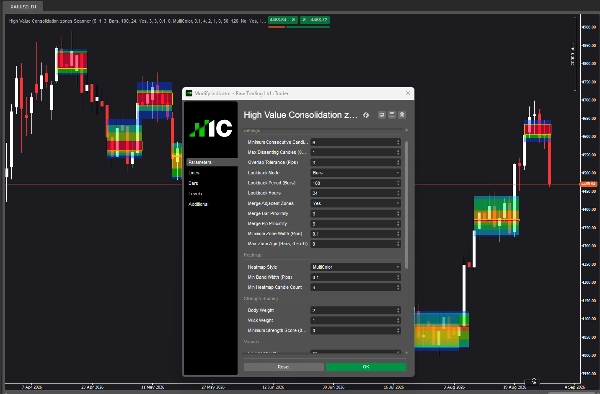
Heatmap dinamis dibangun dengan menganalisis distribusi aktivitas candle dalam setiap zona. Level harga dengan aktivitas lebih tinggi ditampilkan dengan warna yang lebih hangat (merah/oranye), sedangkan level aktivitas lebih rendah ditampilkan dengan warna yang lebih dingin (biru). Ini memberikan visual langsung tentang di mana harga benar-benar diperdagangkan.
Beberapa zona dapat digabungkan jika mereka tumpang tindih dalam harga dan berdekatan dalam waktu, mengurangi kekacauan grafik dan menciptakan zona yang lebih luas dan lebih bermakna.
--------------------------------------------------
FITUR UTAMA
- DETEKSI KONSOLIDASI OTOMATIS: Mengidentifikasi zona di mana candle secara konsisten tumpang tindih, dengan minimum candle berturut-turut dan toleransi dissent yang dapat dikonfigurasi.
- VISUALISASI HEATMAP: Menampilkan kepadatan aktivitas dalam setiap zona, dengan warna yang lebih hangat menunjukkan aktivitas candle yang lebih tinggi.
- SKOR BODY VS WICK: Membedakan sentuhan kuat (body di zona) dari sentuhan lemah (hanya wick), memberikan skor kekuatan untuk setiap zona.
- LOGIKA PENGGABUNGAN: Zona yang berdekatan yang tumpang tindih dalam harga dan dekat dalam waktu digabungkan menjadi zona yang lebih luas dan lebih bermakna.
- ALERT MASUK ULANG ZONA: Peringatan opsional saat harga masuk kembali ke zona yang sebelumnya terdeteksi, dengan cooldown yang dapat dikonfigurasi.
- MEMUDAR SESUAI UMUR: Zona secara bertahap memudar seiring bertambahnya umur, menjaga fokus pada area yang baru dan relevan.
- LOOKBACK YANG DAPAT DIKONFIGURASI: Pilih antara periode lookback berbasis bar atau jam.
- PENYARINGAN KEKUATAN: Menyaring zona lemah berdasarkan skor kekuatan minimum.
- VISUAL YANG DAPAT DISESUAIKAN: Warna zona, opasitas isi, ketebalan border, posisi label, dan ekstensi bar kanan.
--------------------------------------------------
PANDUAN PARAMETER
PENGATURAN
Minimum Candle Berturut-turut: Jumlah minimum candle yang harus tumpang tindih secara konsisten untuk membentuk zona. Nilai lebih tinggi menghasilkan zona yang lebih besar dan lebih signifikan. Nilai lebih rendah menghasilkan zona yang lebih kecil. Default adalah 6.
Maksimum Candle Dissenting: Jumlah maksimum candle yang tidak tumpang tindih yang diizinkan dalam urutan. Nilai 0 mengharuskan tumpang tindih berturut-turut yang sempurna. Nilai lebih tinggi mengizinkan beberapa celah. Default adalah 1.
Toleransi Tumpang Tindih (Pips): Toleransi dalam pips untuk menganggap sebuah candle tumpang tindih dengan zona. Default adalah 3.0. Tingkatkan ini untuk zona yang lebih lebar pada pasangan yang volatil. Kurangi untuk zona yang lebih ketat.
Mode Lookback: Pilih antara Bars dan Hours untuk periode lookback. Mode Bars menggunakan jumlah candle tetap. Mode Hours menghitung jumlah candle berdasarkan timeframe grafik.
Periode Lookback (Bars): Jumlah bar yang dipindai untuk zona. Default adalah 100. Tingkatkan untuk zona jangka panjang pada timeframe yang lebih tinggi. Kurangi untuk fokus pada aktivitas terbaru pada timeframe yang lebih rendah.
Jam Lookback: Jumlah jam yang dipindai untuk zona. Default adalah 24. Gunakan dengan mode Hours.
Gabungkan Zona Berdekatan: Saat diaktifkan, zona yang tumpang tindih dalam harga dan dekat dalam waktu digabungkan. Default adalah true.
Kedekatan Bar untuk Penggabungan: Jumlah maksimum bar antara zona untuk mempertimbangkan penggabungan. Default adalah 3.
Kedekatan Pip untuk Penggabungan: Jarak harga maksimum dalam pips untuk mempertimbangkan penggabungan zona. Default adalah 3.0.
Lebar Minimum Zona (Pips): Lebar minimum yang harus dimiliki zona agar ditampilkan. Default adalah 0.1. Tingkatkan untuk menyaring zona yang sangat sempit.
Umur Maksimum Zona (Bars): Umur maksimum zona dalam bar. Zona yang lebih tua dari ini dihapus. Default adalah 0 (mati).
HEATMAP
Gaya Heatmap: Pilih antara Off, MultiColor, atau SingleColor. MultiColor menggunakan spektrum penuh dari biru ke merah. SingleColor menggunakan variasi warna zona yang dipilih.
Lebar Minimum Band (Pips): Lebar minimum band heatmap individual. Default adalah 0.1.
Jumlah Minimum Candle Heatmap: Jumlah minimum candle yang harus tumpang tindih sebuah band agar ditampilkan. Default adalah 4. Tingkatkan untuk menampilkan hanya band yang paling aktif.
SKOR KEKUATAN
Bobot Body: Bobot yang diberikan pada candle body-in-zone dalam skor kekuatan. Default adalah 2.0. Nilai lebih tinggi memprioritaskan candle dengan body di dalam zona.
Bobot Wick: Bobot yang diberikan pada candle wick-only dalam skor kekuatan. Default adalah 1.0. Nilai lebih rendah mengurangi pentingnya sentuhan wick-only.
Skor Kekuatan Minimum: Skor kekuatan minimum yang diperlukan agar zona ditampilkan. Default adalah 0 (mati). Tingkatkan untuk menyaring zona yang lemah.
VISUAL
Persentase Opasitas Isi: Opasitas isi zona. Default adalah 50 persen.
Persentase Intensitas Warna: Intensitas warna zona. Default adalah 120 persen.
Aktifkan Memudar Sesuai Umur: Saat diaktifkan, zona memudar seiring bertambahnya umur. Default adalah false.
Tampilkan Border Inti: Saat diaktifkan, border digambar di sekitar zona. Default adalah true.
Ketebalan Border: Ketebalan border zona. Default adalah 1.
Warna Zona: Warna yang digunakan untuk zona saat heatmap mati atau dalam mode SingleColor. Default adalah Gold.
Tampilkan Label: Saat diaktifkan, label ditampilkan pada setiap zona. Default adalah false.
Tampilkan Kekuatan di Label: Saat diaktifkan, skor kekuatan ditampilkan di label. Default adalah false.
Posisi Label: Posisi label pada zona: Atas, Tengah, atau Bawah. Default adalah Tengah.
Warna Label: Warna label zona. Default adalah Putih.
Perpanjang Bar Kanan: Jumlah bar untuk memperpanjang zona ke kanan. Default adalah 0.
PERINGATAN
Peringatan Saat Masuk Ulang Zona: Saat diaktifkan, peringatan dipicu saat harga masuk kembali ke zona. Default adalah false.
Cooldown Peringatan (Bars): Jumlah minimum bar antara peringatan untuk zona yang sama. Default adalah 5.
--------------------------------------------------
KASUS PENGGUNAAN
- Identifikasi zona konsolidasi untuk strategi breakout atau mean-reversion
- Gunakan skor body-in-zone vs wick-only untuk menilai kualitas zona
- Heatmap mengungkap level harga paling aktif dalam setiap zona
- Peringatan masuk ulang zona menangkap retest level kunci
- Gunakan dengan indikator tren untuk menyaring zona berdasarkan arah pasar
- Tempatkan stop di atas atau di bawah zona konsolidasi berkualitas tinggi
--------------------------------------------------
ALUR KERJA YANG DIREKOMENDASIKAN
Langkah 1: Pasang indikator ke grafik Anda dengan pengaturan default.
Langkah 2: Identifikasi zona dengan skor kekuatan tinggi dan rasio body-in-zone tinggi.
Langkah 3: Periksa heatmap untuk melihat di mana aktivitas harga terkonsentrasi.
Langkah 4: Gunakan zona sebagai level support/resistance potensial untuk entri dan keluar.
Langkah 5: Aktifkan peringatan untuk masuk ulang zona guna menangkap retest.
--------------------------------------------------
CONTOH PRAKTIS
Pada grafik EURUSD H1, indikator mendeteksi zona konsolidasi antara 1.0850 dan 1.0875 dengan 10 candle berturut-turut. Zona tersebut memiliki 8 candle body-in-zone dan 2 candle wick-only, memberikan skor kekuatan 18 (8*2 + 2*1).
Heatmap menunjukkan aktivitas terkonsentrasi antara 1.0860 dan 1.0870 (pita merah), menunjukkan di mana harga menghabiskan waktu paling banyak. Ini menjadi area fokus Anda untuk entri.
Saat harga menembus zona ke atas dan kemudian melakukan retest, peringatan masuk ulang dipicu, memberikan peluang entri kedua yang potensial.
--------------------------------------------------
CATATAN TEKNIS
- Indikator overlay (digambar di grafik harga)
- Bekerja pada semua timeframe dan simbol
- Lookback yang dapat dikonfigurasi (bar atau jam)
- Tidak ada repainting; perhitungan bersifat historis
- Dioptimalkan untuk performa
- Kompatibel dengan cTrader
--------------------------------------------------
DUKUNGAN
Pembaruan seumur hidup termasuk.
UNTUK INFORMASI LEBIH LANJUT - Klik Profil Pengembang di bawah.
Ringkasan
The indicator presents a dynamic heatmap within each zone, highlighting price levels with the highest trading activity using color gradients from cool (low activity) to warm (high activity). Adjacent zones that overlap in price and are close in time can be merged to reduce chart clutter and form broader zones. Zones can fade as they age to maintain focus on recent price action.
Additional features include configurable lookback periods (bars or hours), customizable visual settings (color, opacity, border thickness, labels), and optional alerts for price re-entry into detected zones. The scanner supports filtering zones by strength score and provides practical use cases for breakout or mean-reversion strategies, stop placement, and identifying key support and resistance levels. Calculations are historical with no repainting, optimized for performance.