
Описание
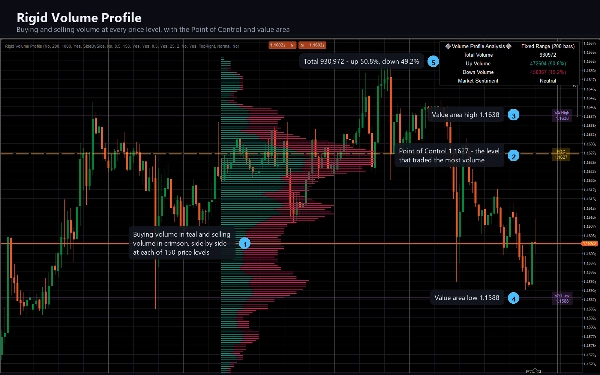
Rigid Volume Profile делит ваше окно просмотра на фиксированное количество ценовых уровней и показывает, какой объем был торгован на каждом из них, разделенный на давление покупателей и продавцов.
ЧТО ОН РИСУЕТ
Горизонтальная гистограмма рядом с ценовым графиком, построенная на основе последних N баров. Каждая полоса уровня разделена на бычий объем (с баров, закрывшихся вверх) и медвежий объем (с баров, закрывшихся вниз), так что вы видите не только где происходила торговля, но и какая сторона ее осуществляла. Бары, закрывшиеся без изменений, равномерно делят свой объем между двумя сторонами.
Пунктирная линия Point of Control отмечает ценовой уровень, на котором был торгован наибольший объем в окне, с указанием точной цены.
Две линии зоны стоимости ограничивают уровни, на которые приходится 70% объема окна, каждая с подписью.
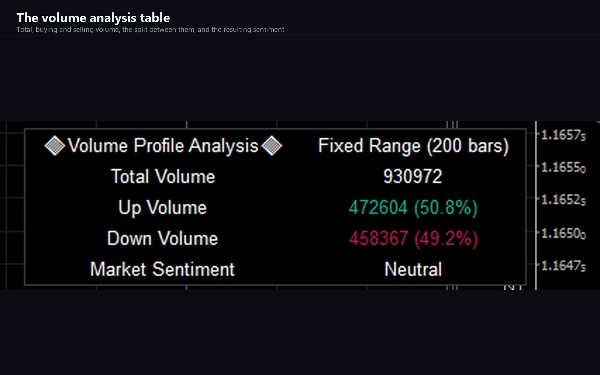
Таблица анализа объема показывает общий, восходящий и нисходящий объем с процентами, а также индикатор настроения на основе доминирующей стороны.
КАК ИСПОЛЬЗОВАТЬ
Профили объема описывают, где фактически происходила торговля, а не просто где перемещалась цена. Уровень, который поглотил большой объем, — это уровень, который важен для многих участников; тонкая часть профиля — это ценовой диапазон, через который рынок прошел быстро.
Считайте Point of Control центром тяжести окна. Считайте зону стоимости диапазоном, где велась основная торговля. Считайте тонкий разрыв между двумя тяжелыми узлами зоной, которую цена склонна пересекать, а не задерживаться в ней. Следите, какая сторона разделения доминирует на уровне, когда цена возвращается к нему.
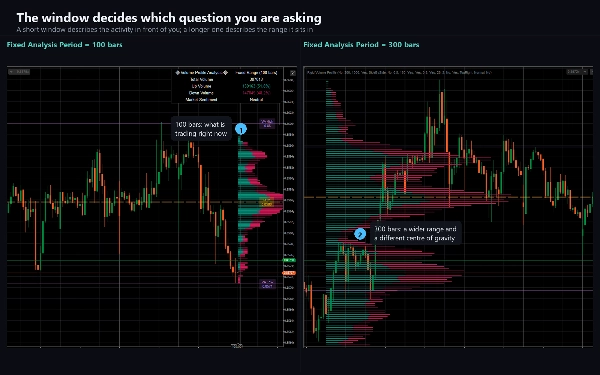
Окно выбираете вы, и картина меняется вместе с ним, поэтому выбирайте период просмотра, соответствующий принимаемому решению. Профиль на 100 баров отвечает на другой вопрос, чем профиль на 500 баров.
КЛЮЧЕВЫЕ НАСТРОЙКИ
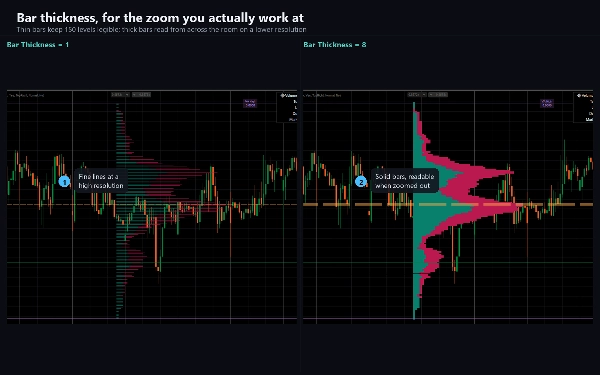
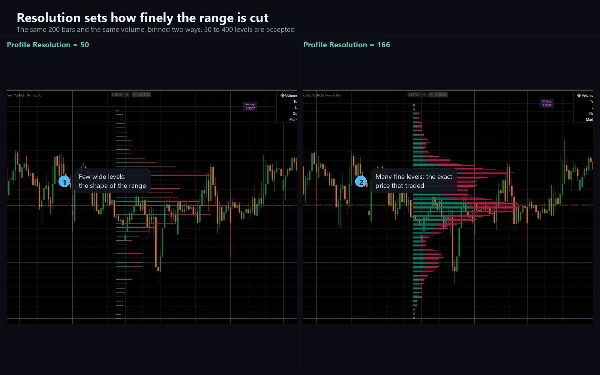
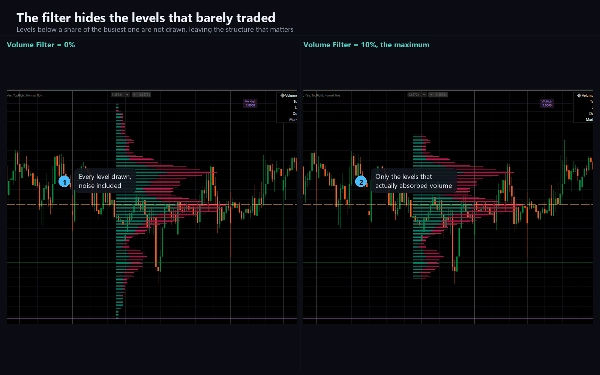
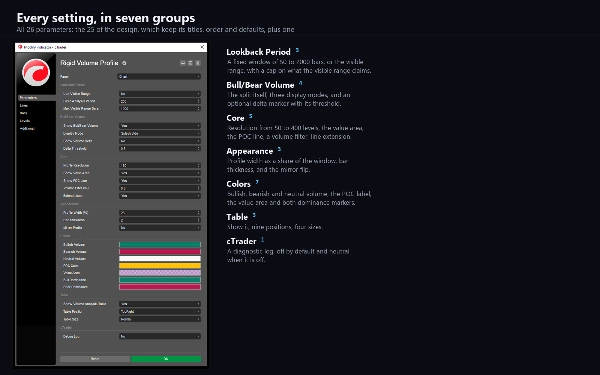
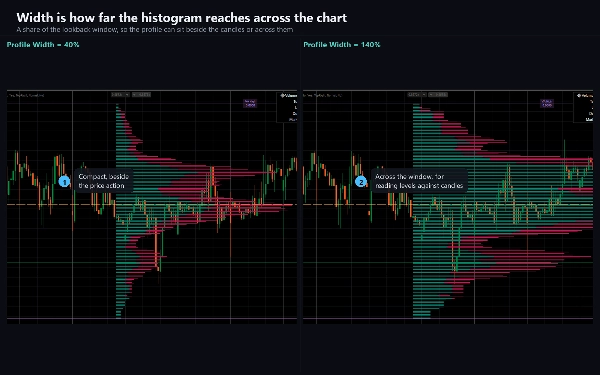
Fixed Analysis Period задает период просмотра в барах, от 50 до 2000. Profile Resolution задает, на сколько ценовых уровней разбит диапазон, от 50 до 400; меньше уровней читается как классический профиль, больше — дает подробности. Display Mode предлагает Side by Side, Stacked и Split. Profile Width масштабирует гистограмму в процентах от периода просмотра. Volume Filter скрывает уровни ниже определенного процента от самого загруженного. Show Volume Delta добавляет маркер, где одна сторона явно доминирует. Каждый цвет настраивается, а таблицу анализа можно переместить в любое из девяти положений или отключить.
Use Visible Range переключает период просмотра на бары, видимые на экране, вместо фиксированного количества.
ТИП ИНДИКАТОРА И ОКНО
Наложение на график. Рисуется непосредственно на ценовом графике, а не в отдельной панели.
ТАЙМФРЕЙМЫ И ИНСТРУМЕНТЫ
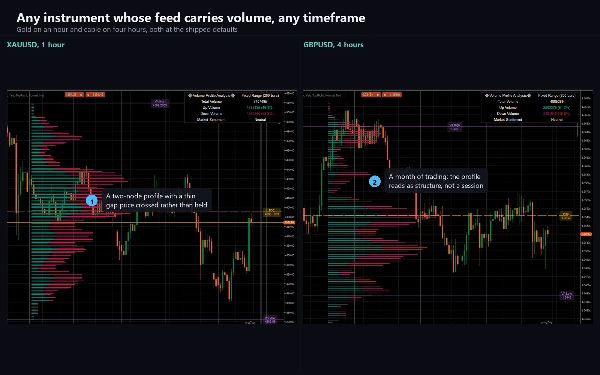
Любой таймфрейм. Наиболее полезен внутри дня, от M5 до H4, где распределение объема сессии имеет смысл.
Работает с любым инструментом, у которого в потоке есть объем. На форексе это тиковый объем, количество обновлений цены за бар, что является прокси активности, а не объема сделок. На индексах и товарных CFD некоторые брокеры предоставляют реальный биржевой объем, и профиль там более значим. На инструменте без объема ничего не рисуется.
ДЛЯ КОГО ОН
Трейдеры, которые уже работают с профилями объема и хотят профиль с настраиваемой фиксированной сеткой и явным разделением покупок и продаж, а не фиксированным сессионным профилем.
ПРОБНАЯ ВЕРСИЯ
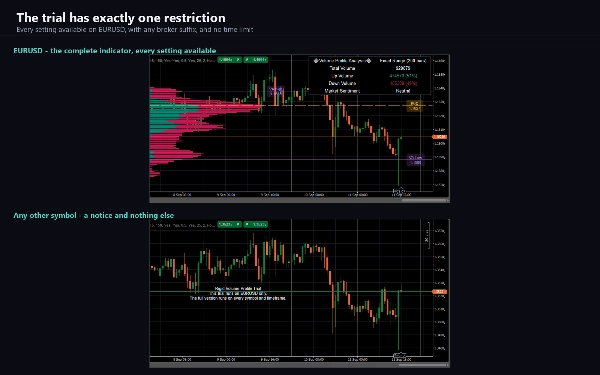
К этому продукту прилагается пробная версия. Это полный индикатор со всеми доступными настройками, ограниченный EURUSD. Полная версия снимает это ограничение и не добавляет ничего другого.
ТЕХНИЧЕСКИЕ ЗАМЕЧАНИЯ И ОГРАНИЧЕНИЯ
Профиль пересчитывается на каждом тике формирующегося бара, поэтому Point of Control и зона стоимости движутся внутри бара и фиксируются при его закрытии. Это сделано специально. Здесь нет сигналов закрытого бара.
При Profile Resolution выше 166 нижние ценовые уровни не рисуются. Это сознательное ограничение дизайна, который резервирует фиксированное количество объектов рисования и использует по три на уровень цены; переключатели Show POC Line и Show Value Area освобождают по одному объекту. Чтобы видеть полный профиль, держите Profile Resolution на уровне 166 или ниже.
Зона стоимости строится путем ранжирования уровней по объему и выбора их в этом порядке до достижения 70%, затем указывается самая высокая и самая низкая цена среди них. Поэтому она обычно шире зоны стоимости, построенной путем расширения от Point of Control.
Поскольку профиль строится на основе объема вашего брокера, два брокера не дадут идентичный профиль с одного и того же рынка.
AccessRights отсутствуют: индикатор не размещает ордера, ничего не изменяет и не читает данные аккаунта.
ПОДДЕРЖКА
Документация, охватывающая каждый параметр, настройки, которые удивляют пользователей, и руководство по устранению неполадок, поставляется с продуктом. Вопросы приветствуются через вкладку Discussion; полезный отчет содержит символ, брокера, таймфрейм, версию cTrader и измененные настройки по сравнению с дефолтом.
Торговля связана с риском. Прошлые результаты не гарантируют будущих.
Сводка
Users can customize the lookback period (50 to 2000 bars), profile resolution (50 to 400 levels), display mode (side by side, stacked, split), profile width, and volume filtering. The profile updates dynamically on every tick of the forming bar. It supports any timeframe and instruments with volume data, including tick volume for forex and real exchange volume for some CFDs. The indicator is intended for traders familiar with volume profiles seeking detailed buying and selling pressure insights on a fixed grid rather than session-based profiles. A trial version is available with full features restricted to EURUSD.