present
Зарегистрируйтесь и получите скидку $50 на первую покупку
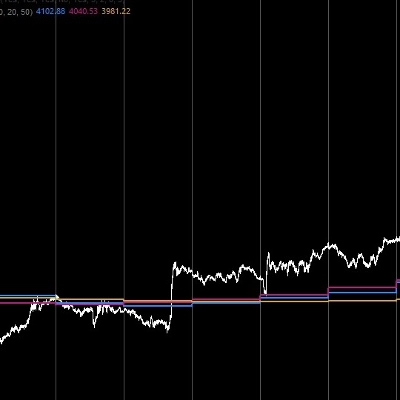
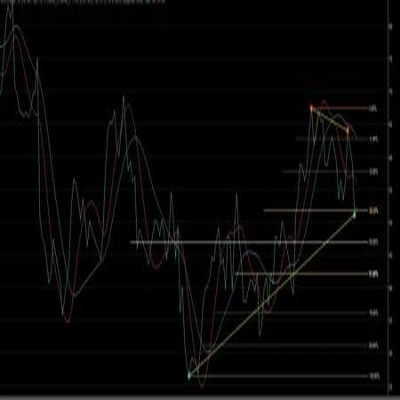
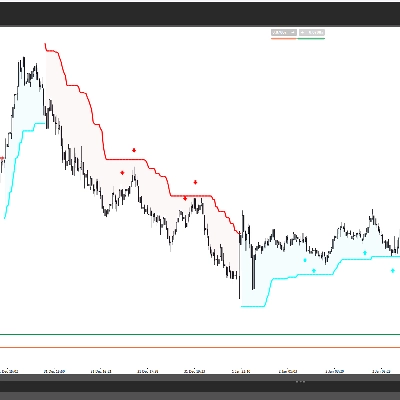
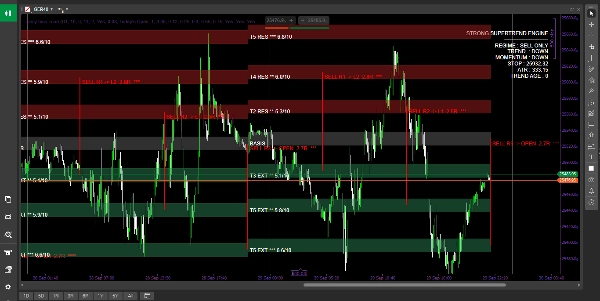
Trading product for StrongSupertrend Индикатор Keltner Channels Key Levels, image 1
StrongSupertrend
Индикатор
Версия 1.0, Oct 2026
Windows, Mac
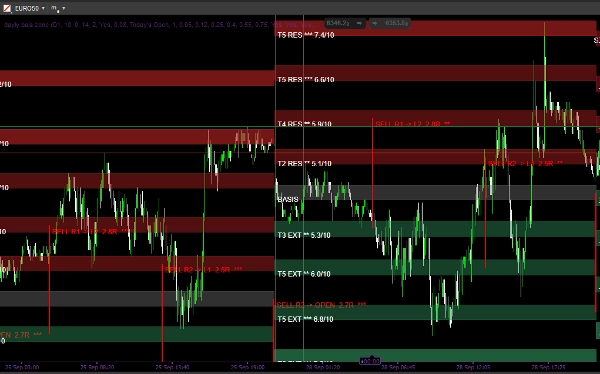
Trading product for StrongSupertrend Индикатор Keltner Channels Key Levels, image 2
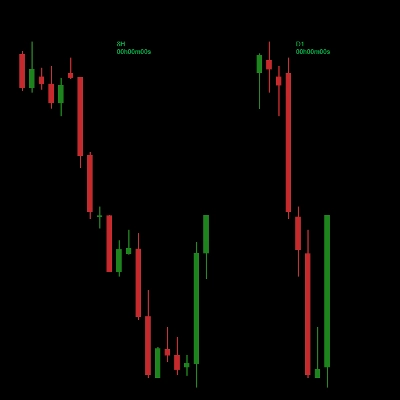
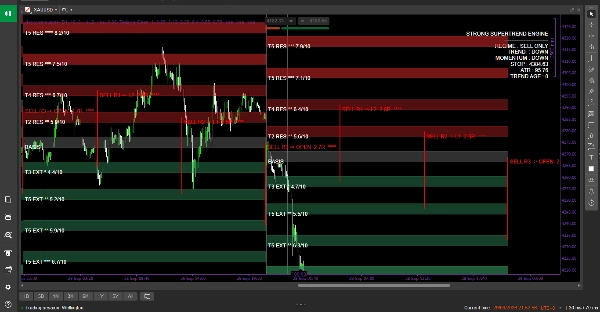
Trading product for StrongSupertrend Индикатор Keltner Channels Key Levels, image 3
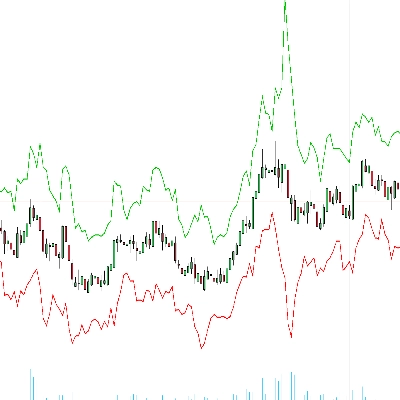
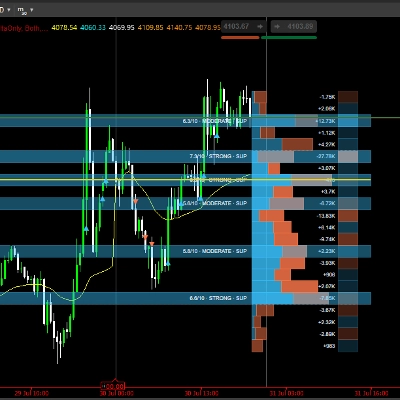
Trading product for StrongSupertrend Индикатор Keltner Channels Key Levels, image 4
С 23/06/2025
1
Продажи

Описание

Strong Supertrend Turn Market Movement into a Clear Map

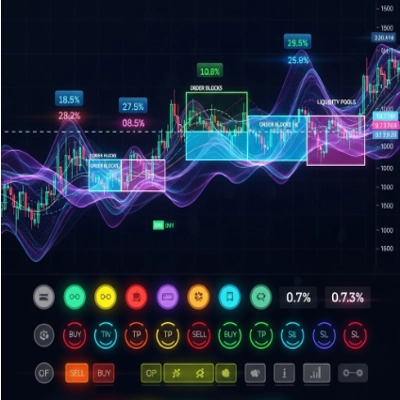
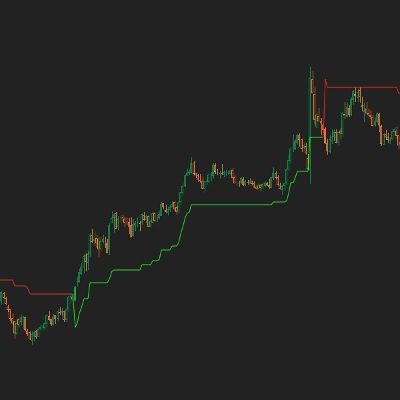
Market analysis is no longer just about searching for a buy or sell signal. The Strong Supertrend Engine is designed to give you a broader view of the market by transforming trend, volatility, momentum, and price zones into an easy-to-read dynamic map. The indicator relies on the Supertrend, ATR, and Basis to build a clear market structure, then identifies multiple levels around the price and evaluates the strength of each zone with a score from 0 to 10 to help you identify the areas worth watching. Through Laguerre Momentum analysis and a custom Dashboard interface, you can see the trend, momentum status, and market level at a glance, alongside potential continuation scenarios and risk-to-reward ratios. The indicator is not merely a tool that gives you an arrow on a chart; rather, it is a comprehensive analysis system that translates complex price action into an organized map, helping you understand where the market is moving, what the key zones are, and when you need further confirmation before making a decision.

How to Use: Start by reading the Dashboard to determine the overall market condition, trend, and momentum. Then, use the Basis as a reference point to understand the price position, while monitoring the five zone layers above and below it, paying closer attention to higher-rated zones. Use the Supertrend zone as an additional reference for the trend and for support or resistance, and watch how the price interacts with the specified zones instead of entering blindly the moment price reaches them. Afterward, a smaller timeframe can be used to confirm price action and determine the entry point, stop loss, and target. Meanwhile, the Continuation scenarios displayed by the indicator serve as potential visualizations of continuing movement rather than automated trading orders. In this way, the indicator functions as a decision-making map: it defines the context and critical zones first, leaving the trader responsible for entry confirmation and risk management.

Сводка

AI summary
StrongSupertrend is a comprehensive trading indicator that transforms market movement into a clear, dynamic map by integrating trend, volatility, momentum, and price zones. It combines Supertrend, Average True Range (ATR), and Basis calculations to construct a structured market overview, highlighting multiple price levels with strength scores ranging from 0 to 10. The indicator incorporates Laguerre Momentum analysis and presents data through a custom Dashboard interface, enabling users to quickly assess trend direction, momentum status, key market zones, and potential continuation scenarios alongside risk-to-reward ratios.

Users start by interpreting the Dashboard to gauge overall market conditions, then use the Basis as a price reference point while monitoring five zone layers above and below it, focusing on higher-rated zones. The Supertrend zone serves as an additional trend and support/resistance reference. Price interactions with these zones guide decision-making rather than triggering automatic entries. Traders can confirm entries, stop losses, and targets using smaller timeframes. Continuation scenarios provide visual forecasts of possible market moves without automated orders. This indicator functions as a decision-making tool that organizes complex price action into an accessible format, supporting informed trading decisions. It supports visualization outputs and signals including trend strength, volatility regime, level breaks, and level touches, relying on bar and volume data inputs.
Профиль индикатора
Категория индикатора
Тренд
Тип вывода
Визуализация
Требования к данным
Только бары
Объем
Поддерживаемые сигналы
Сила тренда
Волатильность
Прорыв уровня
Касание уровня

Отзывы покупателей

0.0
Отзывы: 0
Отзывы покупателей
У этого продукта еще нет отзывов. Уже попробовали его? Поделитесь впечатлениями!

Обсуждение

Частые вопросы

Keltner Channels
Key Levels
ATR
Wedge
Продукты, доступные в cTrader Store, включая торговых ботов, индикаторы и плагины, предоставляются сторонними разработчиками и доступны исключительно в информационных и технических целях. cTrader Store не является брокером и не предоставляет инвестиционные консультации, персональные рекомендации или какие-либо гарантии будущей доходности.

Больше от этого автора

Индикатор
VWAP
Volume
+4
Advanced Order Flow & Volume Profiling for cTrader. Unveil institutional footprints, Delta, and Anchored VWAPs.

Вам также может понравиться

Индикатор
ATR
RSI
+24
Daily moving averages, simplified. Displays 3 daily moving averages on lower timeframes with selectable MA types.
Логотип продукта "FVG Scanner"
Новинка
5.0
(1)
$25
Индикатор
Imbalance
Fair Value Gap
+1
Multi-symbol, multi-timeframe Fair Value Gaps in one panel.
Логотип продукта "Vwap Bands"
Высокий рейтинг
4.5
(4)
$19
/
$29
Индикатор
VWAP
Moving Average
Vwap Bands it is highly sought after by professional traders because it includes Standard Deviation Bands
Индикатор
EMA
RSI
+5
MACD Colour Histogram with 11 Moving Average Types, Multi-timeframe confirmation and Sound Signal Alert.
Индикатор
Block Liquidity,indicator.Block Order, Liquids Stops, Signal Sentiment,signal correctio.
Индикатор
RSI
MACD
This indicator is a combination of MACD and RSI into one. This is perfect fusion and powerful indicator ever.
Индикатор
ATR
Forex
+11
Trend-following indicator with dynamic ATR-based trailing stop for precise entry/exit signals
Индикатор
ADX
ATR
+2
GOLD SENTINEL v1.0 - A CANDLE-COLORING INDICATOR FOR GOLD.
Логотип продукта "RSI Overlay"
Новинка
5.0
(1)
от $9
Индикатор
RSI
RSI on the main chart with 45/55 momentum levels, overbought/oversold levels, averaged RSI, and multi-timeframe support.
Индикатор
RSI
Forex
+4
New version of one of my favorites includes Fibonacci and moving average convergence divergence lines
Индикатор
ATR
EMA
+2
Eight-EMA ribbon with ATR trade zones, a nine-symbol screener and a five-timeframe trend dashboard.
Индикатор
SMC
Prop
+13
Perfect for traders who demand a clear overview of multiple timeframes at a glance.
Индикатор
RSI
Forex
+6
What Constance Brown did with the RSI was to input a momentum calculation within the RSI itself. This the Composite RSI.
Индикатор
ATR
Prop
+13
Enhance trading with ATR Bands! Visualize market volatility using dynamic upper and lower ATR bands for precise decision
Индикатор
MACD
Forex
+6
Auto Signal BUY SELL is a professional decision-making tool designed to help you follow the trend and capture high-proba
Индикатор
Volume
Custom range volume profile between two draggable anchors. Auto source timeframe, Total/Up-Down/Delta, POC, Value Area.
Индикатор
Forex
BTCUSD
+4
The Linear Regression Oscillator (LRO) is a technical indicator based on linear regression analysis.
Индикатор
AI
ATR
+27
Trade the Trend Flip. Control the Risk. 🎯📈”

Цена

С 23/06/2025
1
Продажи