present
Зарегистрируйтесь и получите скидку $50 на первую покупку
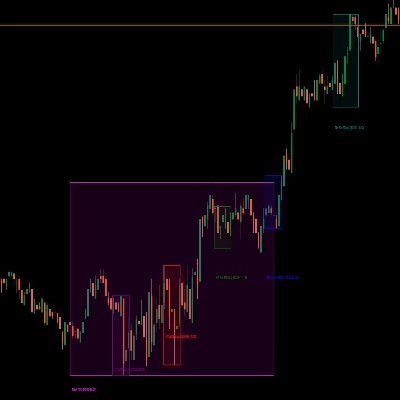
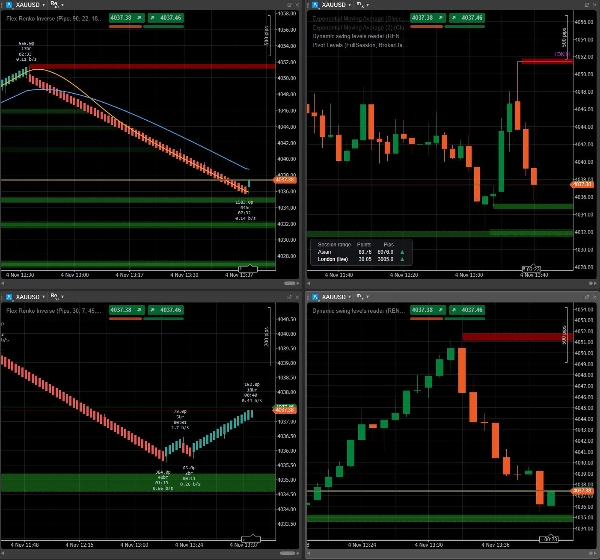
Trading product for Dynamic swing levels reader Индикатор Fibonacci Fair Value Gap, image 1
Dynamic swing levels reader
Индикатор
Версия 1.1, Nov 2026
Windows, Mac
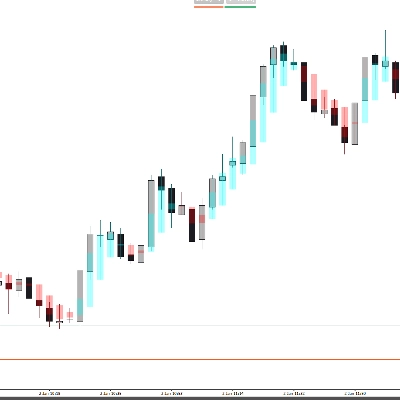
Trading product for Dynamic swing levels reader Индикатор Fibonacci Fair Value Gap, image 2

Описание

Dynamic Swing Levels Reader - the companion to Flex Renko Inverse

Flex Renko charts are excellent for spotting where the market really turned. Most traders, though, still execute on regular timeframe charts: M1, M5, H1. Dynamic Swing Levels Reader connects the two. It takes the swing zones from a Flex Renko Inverse chart and draws them, live, on any timeframe chart of the same symbol.


What "Requires Flex Renko Inverse" means

This indicator does not calculate anything by itself. It is a reader. The zones are created by Flex Renko Inverse, our main study, which builds renko bricks tick by tick and marks every confirmed reversal as a swing zone. Zones that price has not yet come back to are shared, and the Reader displays exactly those.

Without Flex Renko Inverse running on one of your charts, the Reader has nothing to show. That is why it is free: it extends the main study, it does not replace it.


How it works

  1. Open a Flex Renko Inverse chart and give it a name in "Instance name" (for example RENKO_CONTEXT)
  2. On any timeframe chart of the same symbol, add Dynamic Swing Levels Reader and type the same name in "Read swing levels from"
  3. That's it. The zones appear and stay in sync. When price reaches a zone it disappears from both charts, and new zones show up as soon as the renko chart creates them

Both charts must be open in cTrader on the same computer. If something is not connected (wrong name, different symbol, renko chart closed), the indicator tells you on the chart what is missing.


Why get Flex Renko Inverse

The swing zones are just one of its features. Flex Renko Inverse gives you:

  • Renko bricks built from real ticks, never from aggregated bars, with separate settings for trend continuation and reversal. Closed bricks never repaint
  • Swing zones with strength: the bigger the move that started from a turning point, the more visible its zone
  • Leg labels with the size, number of bricks, duration and speed of every swing, plus an arrow when the current leg is moving faster than usual
  • A rotation dashboard that shows, across 1, 5, 15 and 30 minutes, whether swings are getting wider or narrower and which side is in control
  • Moving averages calculated on bricks, not on hidden candles
  • The real time of every brick under your cursor

Use a slower renko as your context, share its zones, and trade them on the timeframe you are used to.


👉 Get Flex Renko Inverse: https://ctrader.com/products/5546

Сводка

ИИ-сводка
Dynamic Swing Levels Reader is an indicator designed to display swing level zones generated by the Flex Renko Inverse study on any timeframe chart within cTrader. It functions as a companion tool that reads and visualizes swing zones created by Flex Renko Inverse, which builds Renko bricks tick-by-tick and identifies confirmed reversals as swing zones. These zones are shared live and synchronized between the Flex Renko Inverse chart and any other chart of the same symbol, allowing traders to view Renko-based swing levels on their preferred timeframe charts (e.g., M1, M5, H1).

To use it, a Flex Renko Inverse chart must be open and named; the Dynamic Swing Levels Reader then references this name to display the corresponding swing zones. Zones disappear once price revisits them, and new zones appear as the Renko chart updates. Both charts must be open simultaneously on the same computer.

Flex Renko Inverse offers advanced features including real-tick Renko bricks with separate trend and reversal settings, swing zones weighted by move strength, detailed leg metrics (size, duration, speed), a multi-timeframe rotation dashboard, and moving averages calculated on bricks. This setup enables traders to use slower Renko charts for market context while executing trades on their usual timeframe charts.

Профиль индикатора
Категория индикатора
Поддержка и сопротивление
Тип вывода
Визуализация
Требования к данным
Только бары
Внешние данные
Поддерживаемые сигналы
Пересечение
Расхождение
Прорыв
Разворот
Сила тренда
Волатильность
Касание уровня
Прорыв уровня

Обсуждение

Отзывы покупателей

0.0
Отзывы: 0
Отзывы покупателей
У этого продукта еще нет отзывов. Уже попробовали его? Поделитесь впечатлениями!

Частые вопросы

Fibonacci
Fair Value Gap
Key Levels
Order Block
Market Structure
Supply & Demand
Support & Resistance
Продукты, доступные в cTrader Store, включая торговых ботов, индикаторы и плагины, предоставляются сторонними разработчиками и доступны исключительно в информационных и технических целях. cTrader Store не является брокером и не предоставляет инвестиционные консультации, персональные рекомендации или какие-либо гарантии будущей доходности.

Больше от этого автора

Логотип продукта "Flex Renko Inverse"
Высокий рейтинг
4.2
(4)
$99
Индикатор
Pin Bar
Order Block
+5
NEVER MISS A TREND & LET TRENDS RUN with Sierra Chart's Flex Renko Inverse, rebuilt for cTrader.
Индикатор
Fibonacci
Key Levels
+5
Draws RTH, Asian, London, prior day/week, ORB, Floor and Camarilla pivot levels as rays, with a session range table.

Вам также может понравиться

Логотип продукта "ICT Killzones & Macros"
Высокий рейтинг
4.7
(4)
$20
/
$30
Индикатор
SMC
Prop
+8
KILLZONES AND MACRO SESSIONS
Индикатор
AI
SMC
+5
Complete ICT Killzones: 5 sessions, easy colors, transparency controls & session info. Professional timing for cTrader.
Индикатор
Forex
Crypto
+4
Pro Heikin Ashi Visual Overlay – Clean Trend Visualization
Индикатор
Volume
Key Levels
View tick activity across a selected chart range with Point of Control, Value Area High and Value Area Low.
Индикатор
E7 Harmonic Structures Basic.
Индикатор
The long awaited new and improved Supply Demand Premium V2 indicator. Unlock greater trading opportunities now!
Индикатор
Bollinger
Complete MA-channel system: colored trend, channel boundaries & equilibrium with 6 Fib zones.
Индикатор
Doji
Wedge
+5
Angora Pattern Recognition is a cTrader indicator that finds, draws and tracks classic chart patterns automatically.
Индикатор
ATR
SMC
+15
Plot ATR-based SL and 1R/2R/3R TPs instantly for any trade, with clear R-multiple risk mapping.
Индикатор
AI
ATR
+27
Read aggressive flow in real time. Flexible resets (Day/Week/Month), optional EMA smoothing, and non-repainting cumulati
Индикатор
Forex
EURUSD
+5
Session Volume Profile is a professional volume profile indicator for cTrader.
Индикатор
ATR
Forex
+2
Trade fearlessly: auto-adjusts order blocks, manages risks, and ensures precision. Was Free for early users now -80%
Индикатор
Volume
Key Levels
+1
Order book indicator .Don't trade against the flow. Trade with the truth!
Индикатор
ZigZag
Indices
+2
Auto Trendlines, Fibonacci, Pitchfork and Patterns from non‑repainting pivots. One‑click Presets, targeted Alerts, and a
Логотип продукта "OrderPrice-V3"
Высокий рейтинг
4.0
(4)
$19
Индикатор
RSI
MACD
+2
A straightforward yet effective tool signals entry points for both buying and selling. Include 3 Moving Average
Индикатор
Imbalance
Key Levels
+5
Smart Money Concepts (SMC) indicator with real-time Fair Value Gap (FVG) boxes, $50 round numbers, and live market HUD.
Логотип продукта "Osvolt Trend Hunter"
Высокий рейтинг
4.6
(5)
$45
/
$60
Индикатор
ATR
RSI
+5
Multi-timeframe trend indicator using EMA, MACD & ADX to confirm high-probability buy and sell bias.
Индикатор
SMC
Prop
+5
Order Block PRO — Smart Institutional Zone Detector

Цена