説明
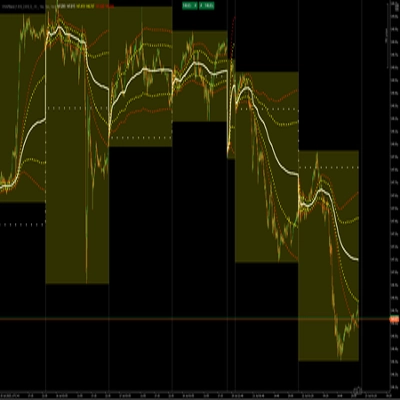
- FXセッションVWAP: アジア、ロンドン、ニューヨーク、シドニーを含む主要なFXセッションのVWAPを追跡し、各市場セッション中の重要なレベルを特定するのに役立ちます。
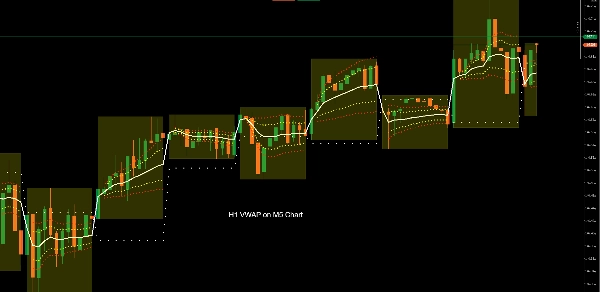
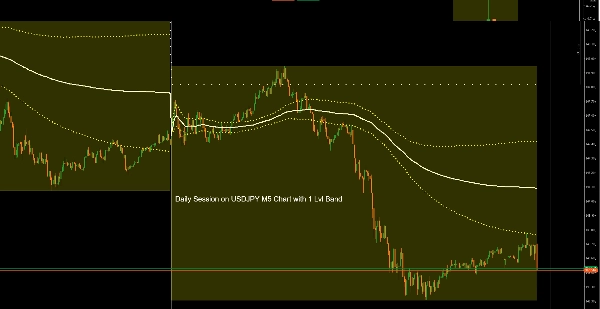
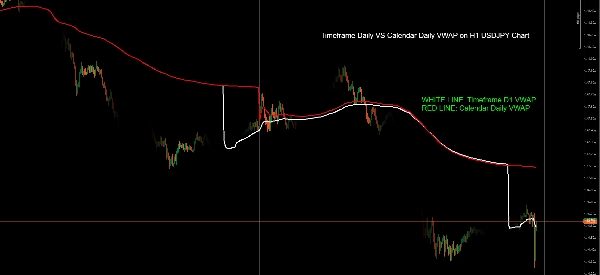
- 高時間足VWAP: 高時間足をセッションとして使用し、デイトレードのトレンドの動きを捉えます。
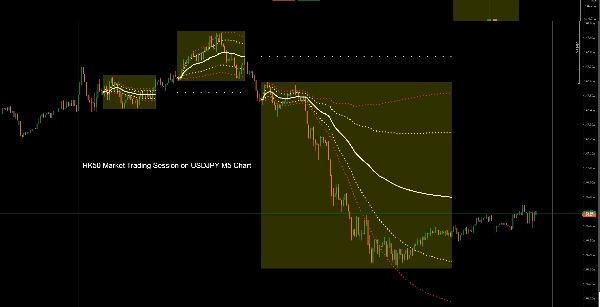
- マーケットセッションVWAP: 現在の市場セッションのVWAPを分析し、最新の価格動向に沿った取引を確実にします。
- 日次、週次、月次VWAP: スキャルパー、デイトレーダー、スイングトレーダーなど、あなたの取引スタイルに合わせて日次、週次、月次のVWAPをシームレスに切り替えます。
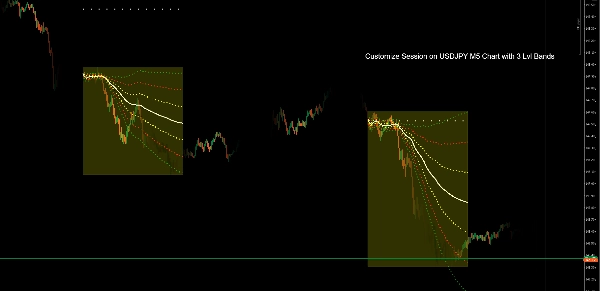
- ユーザー定義セッションVWAP: カスタムセッション時間を設定してインジケーターをあなたの特定のニーズに合わせ、取引スケジュールに完全に一致させます。
- FXセッションVWAPピボット: セッション固有のVWAPピボットでさらなる明確さを得て、日中取引戦略に最適です。
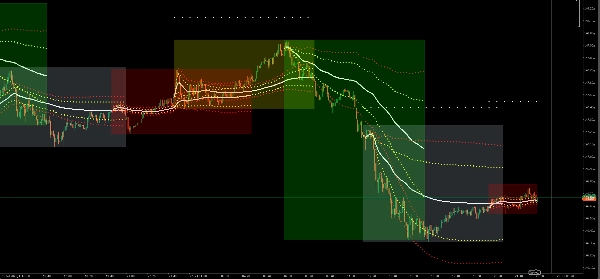
- 3つのカスタマイズ可能な標準偏差バンド: 好みの標準偏差乗数を定義して強いトレンドとレンジを捉えます。
概要
インジケーターのプロフィール
カスタマーレビュー
0.0
レビュー: 0
カスタマーレビュー
この商品にはまだレビューがありません。お使いになったことがある方は、ぜひレビューをお願いします。
ディスカッション
よくあるご質問
cTrader Storeで入手可能な取引ボット、インジケーター、プラグインなどの商品は、第三者の開発者が提供するものであり、情報と技術の取得のみを目的としてご利用いただけます。cTrader Storeはブローカーではなく、投資助言や個人的な推奨を行うことも、将来のパフォーマンスを保証することもありません。
この作成者の他の商品


これも好きかも


![「[Stellar Strategies] Smart ADX」ロゴ](https://cdn.ctrader.com/image/webp/af13b084-b6f6-41db-b7bc-c7e688b57b05_36929)


価格
9
販売
16
無料インストール