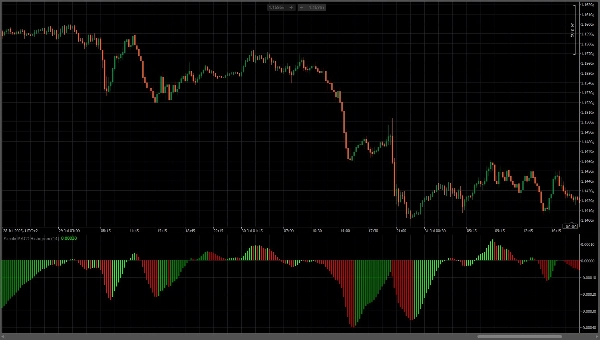
Simple MACD Histogram
"Simple MACD Histogram" โลโก้
03/08/2025
62
Desktop
ตั้งแต่ 15/06/2025
ติดตั้งฟรี
195
"Simple MACD Histogram" ภาพที่อัปโหลด

This custom MACD Histogram indicator displays the MACD histogram with enhanced visual clarity styling. The indicator uses a fast EMA period of 14, automatically calculates the slow EMA as fast plus 2 (16). The indicator features highly contrasted color-coding for instant trend recognition: bright green bars indicate rising momentum (bullish), while red bars show falling momentum (bearish). The histogram bars extend symmetrically from a center zero line, creating an intuitive visual representation where green signals buy pressure and red signals sell pressure. This visualization style provides clear, unambiguous momentum signals and helps identify potential trend reversals and momentum shifts in price action.

0.0
รีวิว: 0
รีวิวจากลูกค้า
ยังไม่มีรีวิวสำหรับผลิตภัณฑ์นี้ หากเคยลองแล้ว ขอเชิญมาเป็นคนแรกที่บอกคนอื่น!
เพิ่มเติมจากผู้เขียนคนนี้
Flex VWAP
Flexible VWAP indicator with timezone-aware, custom time periods and automatic DST handling.
นอกจากนี้คุณยังอาจชอบ
Zones Supply Demand
📊Zones Supply & Demand: Identifies key price levels with high volume concentration, marking Supply/Demand Zones & Marke
KAMA
Custom KAMA Indicator – Optimized for Speed and Precision
IR Moving Average
 this moving include everything that a trader needs from Moving Average.
Prediction Based on Linreg & ATR
📊Predicts price movement by combining multi-timeframe trend analysis, market volatility 📉, and..
LT_Ind_Pivot
Draws pivots (P, S/R, CPR) from selected anchors like H1–Month1, with optional mid-levels (PS1, S1S2, etc.)
ยอดนิยม
$ 50
/
$100
VWAP
Track VWAP for Asia, London, NY, Sydney, Daily, Weekly, Monthly & Custom Sessions. Perfect for FX & intraday trading!
Moving Average channel
This indicator is designed to display customizable moving averages (MAs) on a chart.
เรตติ้งสูง
ฟรี
E7 Volume Profile
E7 Volume Profile, more modern look and feel.
ScalperSignalVisual
Overview of the Fade Breakout Visualizer Indicator
VIX - volatility indicator
Ride the Volatility – Smart VIX Tool
Meridian Pivot Points Pro
🚀See the market’s framework, decide faster. Session-Aware Pivots. Auto Presets. Pro-Grade Zones.🚀
MTF Candles
Multi Timeframe Candle drawing. Draw Any candles from any timeframe on your chart :-)
Weekly Daily Levels
The Weekly Daily Levels indicator shows the OHLC, and mid-point prices for the previous day and week.
Market_Session_Forex
Market Sessions
TraderMaxBBflterXDemo-
TraderMax BB Filter X (DEMO) for cTrader 🧪 Limited-Time Demo Version (24h) TraderMax BB Filter X (DEMO) is a precision
McDonalds Pattern-Bzier Curve
Designed to identify and visualize price reversal patterns using Bézier curves.
VegaXLR - ZigZag Alerts
cTrader ZigZag Alerts: Precision Swing Detection, Alerts, and Fibonacci.