
ADX and ADI
อินดิเคเตอร์
258 ดาวน์โหลด
เวอร์ชัน 1.0, Aug 2025
Windows, Mac
5.0
รีวิว: 2
คำอธิบาย
คุณสมบัติหลัก:
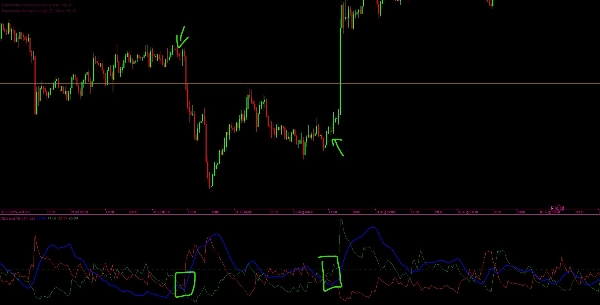
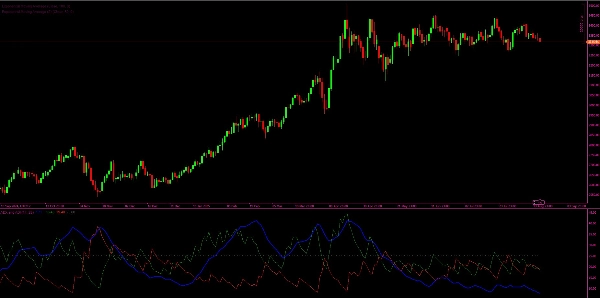
- เส้น ADX และ ADI (สีน้ำเงิน): แสดงความแข็งแกร่งที่เรียบเนียนของแนวโน้มปัจจุบัน โดยไม่คำนึงถึงทิศทาง
- เส้น +DI (สีเขียว): แสดงความแข็งแกร่งของการเคลื่อนไหวขึ้น
- เส้น -DI (สีแดง): แสดงความแข็งแกร่งของการเคลื่อนไหวลง
- เส้นเกณฑ์ (สีเทา): ระดับอ้างอิงแนวนอน (ค่าเริ่มต้น 25) เพื่อช่วยระบุว่า ความแข็งแกร่งของแนวโน้มนั้นมีนัยสำคัญหรือไม่
วิธีการทำงาน:
- ตัวบ่งชี้คำนวณ ช่วงจริง (TR), การเคลื่อนไหวทิศทางบวก (+DM), และ การเคลื่อนไหวทิศทางลบ (-DM).
- ใช้ เทคนิคการเรียบเนียนของ Wilder เพื่อคำนวณค่าที่เรียบเนียนของ TR, +DM, และ -DM
- จากนั้นจะได้ ตัวบ่งชี้ทิศทาง (+DI และ -DI) ซึ่งแสดงให้เห็นว่าฝ่ายใด (กระทิงหรือหมี) มีโมเมนตัมที่แข็งแกร่งกว่า
- คำนวณ DX (ดัชนีทิศทาง) จากความแตกต่างสัมพัทธ์ระหว่าง +DI และ -DI
- สุดท้ายคำนวณ ADX (ดัชนีทิศทางเฉลี่ย) ซึ่งเป็นเวอร์ชันที่เรียบเนียนของ DX ให้ค่ามาตรวัดความแข็งแกร่งโดยรวมของ แนวโน้ม.
การตีความ:
- เมื่อ ADX สูงกว่าค่ากำหนด (เช่น 25) ตลาดถือว่ามีแนวโน้มที่แข็งแกร่ง
- เมื่อ +DI > -DI กระทิงควบคุมตลาด (แนวโน้มขาขึ้น)
- เมื่อ -DI > +DI หมีควบคุมตลาด (แนวโน้มขาลง)
- เมื่อ ADX ต่ำกว่าค่ากำหนด ตลาดถือว่าอยู่ในช่วงเคลื่อนไหวแบบไซด์เวย์ (แนวโน้มอ่อนหรือไม่มีแนวโน้ม)
สรุป
โปรไฟล์อินดิเคเตอร์
รีวิวจากลูกค้า
5.0
รีวิว: 2
5 | 100 % | |
4 | 0 % | |
3 | 0 % | |
2 | 0 % | |
1 | 0 % |
รีวิวจากลูกค้า
December 1, 2025
ADX and ADI delivers clean trend strength and direction signals. ADX shows when the market is actually trending, while +DI and -DI reveal who’s in control. Stable, lightweight and reliable across all timeframes. Best on H1+ for smoother signals. Alerts and zone-highlighting would be great additions.
September 12, 2025
การสนทนา
คำถามที่พบบ่อย
ผลิตภัณฑ์ที่มีให้บริการผ่าน cTrader Store รวมถึงบอทการเทรด อินดิเคเตอร์ และปลั๊กอิน มีให้บริการโดยนักพัฒนาบุคคลที่สามและมีไว้เพื่อวัตถุประสงค์ในการเข้าถึงข้อมูลและทางเทคนิคเท่านั้น cTrader Store ไม่ใช่โบรกเกอร์และไม่ได้ให้คำแนะนำการลงทุน คำแนะนำส่วนบุคคล หรือการรับประกันผลการดำเนินงานในอนาคต


!["[Stellar Strategies] MARSI Signal Plotter" โลโก้](https://cdn.ctrader.com/image/webp/7b2b8da6-8f8e-4646-8d4a-4710c516c01e_25567)


ราคา
ตั้งแต่ 21/02/2025
466.3M
ปริมาณการเทรด
180.83K
Pips ที่ได้กำไร
22
การขาย
6.79K
ติดตั้งฟรี