
TrendFibonacci
อินดิเคเตอร์
232 ดาวน์โหลด
เวอร์ชัน 1.0, Sep 2025
Windows, Mac
คำอธิบาย
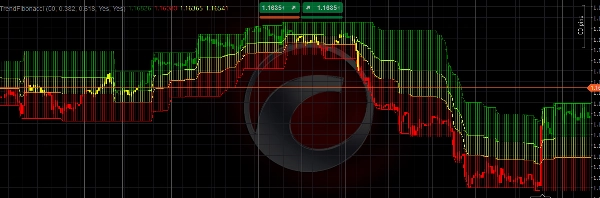
ตัวชี้วัด TrendFibonacci ถูกออกแบบมาเพื่อช่วยเทรดเดอร์ในการระบุระดับราคาที่สำคัญและแนวโน้มตลาดอย่างแม่นยำ โดยการผสานระดับ Fibonacci retracement กับ Weighted Moving Average (WMA) และ Average True Range (ATR) ตัวชี้วัดนี้ให้การแสดงผลที่ชัดเจนและเป็นภาพของแนวรับ แนวต้าน และทิศทางแนวโน้ม
คุณสมบัติหลัก:
- ระดับ Fibonacci แบบไดนามิก: คำนวณและแสดงระดับ Fibonacci retracement โดยอัตโนมัติ (ค่าเริ่มต้น: 0.382 และ 0.618) โดยอิงจากราคาสูงสุดและต่ำสุดในช่วงเวลาที่ผู้ใช้กำหนด
- Weighted Moving Average (WMA): ใช้ WMA 6 ช่วงเวลาเพื่อประเมินทิศทางแนวโน้ม พร้อมแท่งเทียนที่มีสีรหัส (สีเขียวสำหรับแนวโน้มขาขึ้น สีแดงสำหรับแนวโน้มขาลง สีเหลืองสำหรับแนวโน้มเป็นกลาง) เพื่อสะท้อนตำแหน่งของ WMA เทียบกับระดับ Fibonacci
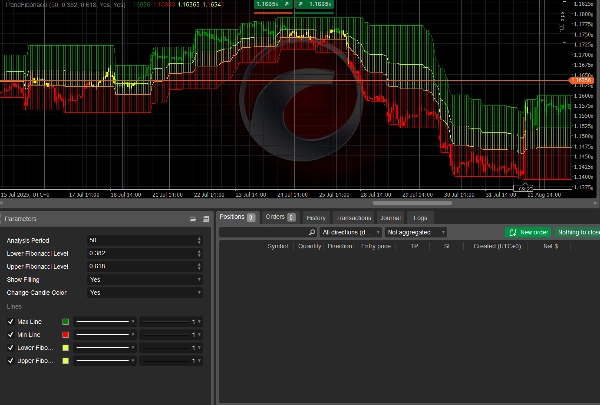
- พารามิเตอร์ที่ปรับแต่งได้: ปรับช่วงเวลาวิเคราะห์ ระดับ Fibonacci และเปิด/ปิดฟีเจอร์ต่างๆ เช่น โซนที่เติมสีและการเปลี่ยนสีแท่งเทียน
- ความชัดเจนทางภาพ: แสดงเส้นสูง/ต่ำและเติมพื้นที่ระหว่างระดับ Fibonacci ด้วยสีโปร่งแสงเพื่อให้ง่ายต่อการระบุแนวโน้ม
- การผสาน ATR: รวม ATR 200 ช่วงเวลาเพื่อการวิเคราะห์ตลาดที่แข็งแกร่งและปรับตัวได้ตามความผันผวน
ตัวชี้วัดนี้เหมาะสำหรับเทรดเดอร์ที่ต้องการผสมผสานการวิเคราะห์ Fibonacci กับกลยุทธ์ติดตามแนวโน้ม ไม่ว่าคุณจะเทรดฟอเร็กซ์ หุ้น หรือสินค้าโภคภัณฑ์ TrendFibonacci ช่วยเพิ่มความสามารถในการระบุโซนกลับตัวสำคัญและตัดสินใจเทรดอย่างมีข้อมูล
วิธีใช้
- ติดตั้งตัวชี้วัด:
-
- เพิ่มตัวชี้วัด TrendFibonacci ลงในแพลตฟอร์ม cTrader ของคุณโดยการอัปโหลดซอร์สโค้ดหรือดาวน์โหลดจากตลาด
- กำหนดค่าพารามิเตอร์:
-
- ช่วงเวลาวิเคราะห์: ตั้งค่าช่วงเวลาย้อนหลัง (ค่าเริ่มต้น: 50 แท่ง) เพื่อกำหนดช่วงสำหรับคำนวณราคาสูง/ต่ำ
- ระดับ Fibonacci ต่ำ: ปรับระดับ Fibonacci retracement ต่ำ (ค่าเริ่มต้น: 0.382)
- ระดับ Fibonacci สูง: ปรับระดับ Fibonacci retracement สูง (ค่าเริ่มต้น: 0.618)
- แสดงการเติมสี: เปิด/ปิดโซนที่เติมสีระหว่างระดับ Fibonacci (ค่าเริ่มต้น: เปิด)
- เปลี่ยนสีแท่งเทียน: เปิด/ปิดแท่งเทียนที่มีสีรหัสตามตำแหน่ง WMA (ค่าเริ่มต้น: เปิด)
- ตีความตัวชี้วัด:
-
- แท่งเทียนสีเขียว: แสดงแนวโน้มขาขึ้นเมื่อ WMA อยู่เหนือระดับ Fibonacci สูง
- แท่งเทียนสีแดง: สัญญาณแนวโน้มขาลงเมื่อ WMA อยู่ต่ำกว่าระดับ Fibonacci ต่ำ
- แท่งเทียนสีเหลือง: บ่งชี้โซนเป็นกลางเมื่อ WMA อยู่ระหว่างระดับ Fibonacci
- โซนที่เติมสี: แสดงโซนราคาสำคัญระหว่างเส้นสูง/ต่ำและระดับ Fibonacci สำหรับการวิเคราะห์แนวรับ/แนวต้าน
- การประยุกต์ใช้ในการเทรด:
-
- ใช้ตัวชี้วัดเพื่อระบุจุดเข้า/ออกที่เป็นไปได้ที่ระดับ Fibonacci
- ผสมผสานกับเครื่องมือทางเทคนิคอื่นๆ (เช่น RSI, MACD) เพื่อยืนยัน
- ติดตามแท่งเทียนที่มีสีรหัสเพื่อประเมินความแข็งแกร่งและทิศทางแนวโน้ม
- แนวทางปฏิบัติที่ดีที่สุด:
-
- ทดสอบตัวชี้วัดในบัญชีทดลองเพื่อทำความคุ้นเคยกับพฤติกรรมของมัน
- ปรับพารามิเตอร์ให้เหมาะสมกับสไตล์การเทรดและสภาพตลาดของคุณ
- ใช้ในกรอบเวลาที่สูงขึ้น (เช่น H1, H4) เพื่อสัญญาณที่น่าเชื่อถือมากขึ้น
ตัวชี้วัด TrendFibonacci เป็นเครื่องมืออเนกประสงค์สำหรับเทรดเดอร์ทุกระดับ ให้ข้อมูลเชิงลึกที่ชัดเจนและนำไปใช้ได้จริงเกี่ยวกับแนวโน้มตลาดและระดับราคา
สรุป
สรุปโดย AI
TrendFibonacci is a technical indicator designed for traders to identify key price levels and market trends by integrating Fibonacci retracement levels with a 6-period Weighted Moving Average (WMA) and a 200-period Average True Range (ATR). It automatically calculates and plots dynamic Fibonacci levels (default 0.382 and 0.618) based on the highest high and lowest low over a user-defined lookback period. The indicator uses color-coded candles—green for bullish, red for bearish, and yellow for neutral—to reflect the WMA’s position relative to the Fibonacci levels, aiding in trend direction assessment.
Users can customize parameters such as the analysis period, Fibonacci levels, and visual features like filled zones between Fibonacci levels and candle color changes. The indicator visually highlights support and resistance zones by plotting high/low lines and filling areas between Fibonacci levels with semi-transparent colors. It is applicable across various markets including forex, stocks, commodities, and popular symbols like BTCUSD, EURUSD, GBPUSD, and XAUUSD.
TrendFibonacci supports traders in spotting potential entry and exit points at Fibonacci levels and can be combined with other technical tools like RSI and MACD for confirmation. It is recommended for use on higher timeframes (e.g., H1, H4) to enhance signal reliability.
โปรไฟล์อินดิเคเตอร์
รีวิวจากลูกค้า
0.0
รีวิว: 0
รีวิวจากลูกค้า
ยังไม่มีรีวิวสำหรับผลิตภัณฑ์นี้ หากเคยลองแล้ว ขอเชิญมาเป็นคนแรกที่บอกคนอื่น!
การสนทนา
คำถามที่พบบ่อย
BTCUSD
Forex
Signal
EURUSD
Commodities
GBPUSD
NZDUSD
RSI
Fibonacci
Stocks
XAUUSD
NAS100
ATR
MACD
USDJPY
ผลิตภัณฑ์ที่มีให้บริการผ่าน cTrader Store รวมถึงบอทการเทรด อินดิเคเตอร์ และปลั๊กอิน มีให้บริการโดยนักพัฒนาบุคคลที่สามและมีไว้เพื่อวัตถุประสงค์ในการเข้าถึงข้อมูลและทางเทคนิคเท่านั้น cTrader Store ไม่ใช่โบรกเกอร์และไม่ได้ให้คำแนะนำการลงทุน คำแนะนำส่วนบุคคล หรือการรับประกันผลการดำเนินงานในอนาคต


ราคา
70.38M
ปริมาณการเทรด
588.67K
Pips ที่ได้กำไร
59
การขาย
4.41K
ติดตั้งฟรี