Descripción
Ultimate RSI (Índice de Fuerza Relativa)
El Ultimate RSI es un oscilador avanzado y personalizado diseñado para ofrecer una lectura más suave, limpia y sensible del impulso del mercado y la fuerza de la tendencia. Representa una mejora significativa sobre el Índice de Fuerza Relativa (RSI) tradicional, enfocándose en filtrar el ruido del mercado y minimizar señales falsas (whipsaws). Esto lo convierte en una herramienta invaluable para confirmar tendencias y localizar puntos de giro confiables.
Características y Mejoras Clave:
- Cálculo de Impulso Aumentado: El indicador utiliza un método sofisticado para calcular el cambio de precio. En lugar de depender únicamente de los movimientos diarios del precio, la señal de impulso se refuerza significativamente cuando el precio registra un nuevo máximo o un nuevo mínimo dentro del período de retroceso. Este proceso asegura que el indicador reaccione con fuerza a rupturas genuinas mientras ignora movimientos menores y erráticos.
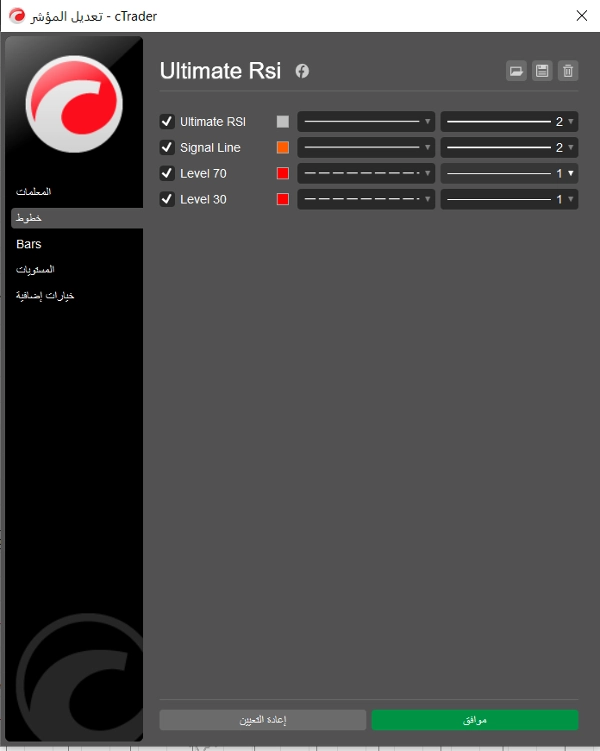
- Línea de Señal Dedicada: Incluye una Línea de Señal distinta (un promedio móvil del propio RSI) que puede configurarse de forma independiente. Los cruces entre la línea Ultimate RSI y su Línea de Señal se usan a menudo como disparadores más claros y con mayor confianza para entradas o salidas, especialmente cerca de niveles de sobrecompra/sobreventa.
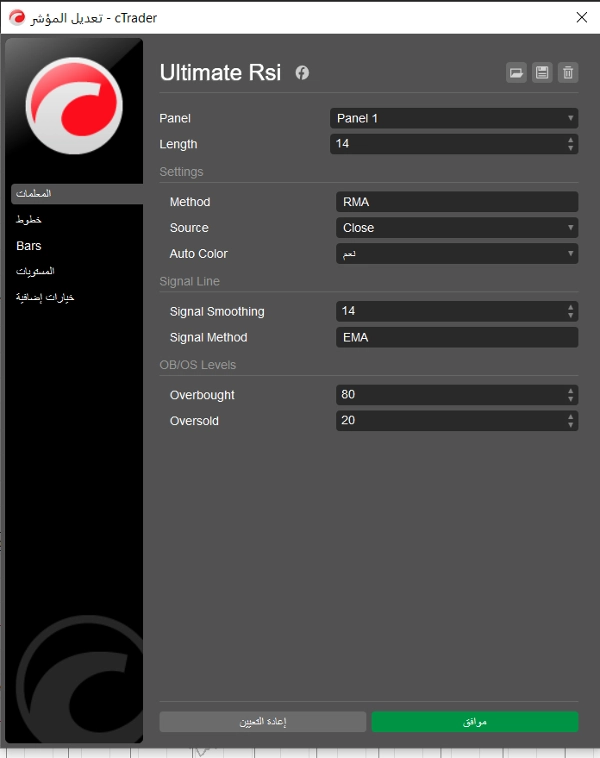
- Métodos de Suavizado Flexibles: Los usuarios tienen la flexibilidad de seleccionar el tipo de suavizado tanto para el cálculo del RSI como para la Línea de Señal entre opciones comunes: EMA (Media Móvil Exponencial), SMA (Media Móvil Simple), RMA (Media Móvil de Wilder), y TMA (Media Móvil Triangular). Esto permite una personalización precisa de la sensibilidad del indicador.
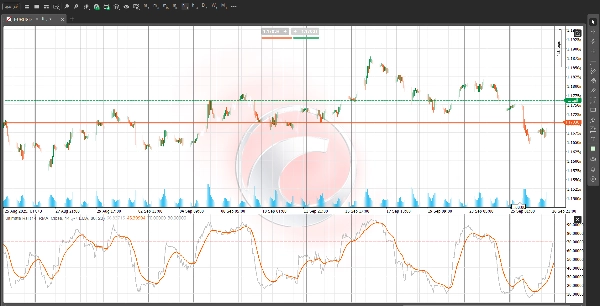
- Zonas Visuales OB/OS: El nivel predeterminado de sobrecompra (OB) en 80 y el nivel de sobreventa (OS) en 20 están claramente marcados con sombreado de fondo. En mercados con tendencias fuertes, lecturas sostenidas dentro de estas zonas a menudo indican una fuerza de tendencia excepcional en lugar de una reversión inmediata, ofreciendo una poderosa herramienta de confirmación para estrategias de seguimiento de tendencia.
Cómo operar con el Ultimate RSI:
- Confirmación de Tendencia: Use el nivel 50 como centro de impulso. Una lectura consistentemente por encima de 50 confirma una tendencia alcista, mientras que una lectura por debajo de 50 confirma una tendencia bajista.
- Señales de Entrada: Busque que la línea Ultimate RSI cruce por encima de la Línea de Señal para una posible entrada larga, y que cruce por debajo de la Línea de Señal para una posible entrada corta, prestando especial atención a dónde ocurren estos cruces en relación con el nivel 50.
- Reducción de Ruido: Al enfatizar la verdadera expansión del rango y utilizar un suavizado avanzado, el Ultimate RSI ayuda a los traders a mantener el enfoque durante períodos de consolidación, evitando entradas o salidas prematuras.
Descargo de responsabilidad: Esta descripción es solo para fines informativos y educativos. El trading implica riesgos, y todas las lecturas del indicador deben combinarse con un análisis completo de la acción del precio para cualquier decisión de trading.


