
Institutional Volume Supply Demand
อินดิเคเตอร์
1.51K ดาวน์โหลด
เวอร์ชัน 1.0, Sep 2025
Windows, Mac
4.4
รีวิว: 5
คำอธิบาย
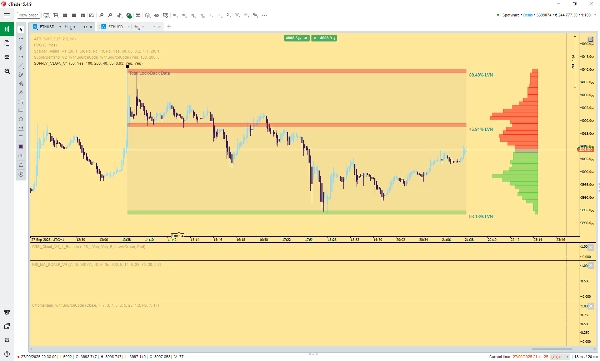
โซนโปรไฟล์ปริมาณ (อุปทาน/อุปสงค์)
ตัวชี้วัด โซนโปรไฟล์ปริมาณ ให้ภาพระดับสถาบันของโครงสร้างตลาดโดยใช้การวิเคราะห์ ปริมาณตามราคา โดยอัตโนมัติระบุระดับสนับสนุนและต้านทานที่มีความน่าจะเป็นสูงโดยอิงจากความไม่มีประสิทธิภาพของตลาดและช่องว่างสภาพคล่อง
คุณสมบัติหลัก:
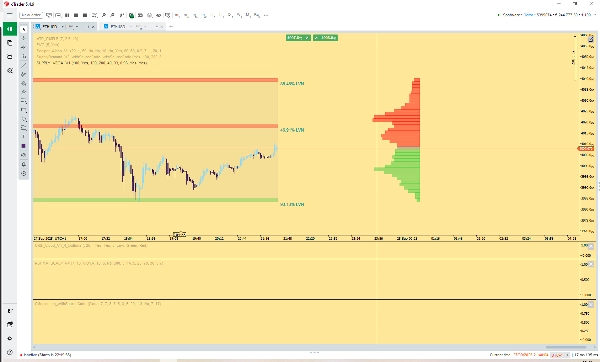
- S&R ระดับสถาบัน (LVNs): คำนวณและทำเครื่องหมายโดยอัตโนมัติ โหนดปริมาณต่ำ (LVNs)—พื้นที่ที่ราคาขยับอย่างรวดเร็วด้วยปริมาณการซื้อขายน้อยที่สุด LVNs เหล่านี้ทำหน้าที่เป็นโซนอุปทาน (ต้านทาน) และอุปสงค์ (สนับสนุน) ที่มีความมั่นใจสูงในอนาคต
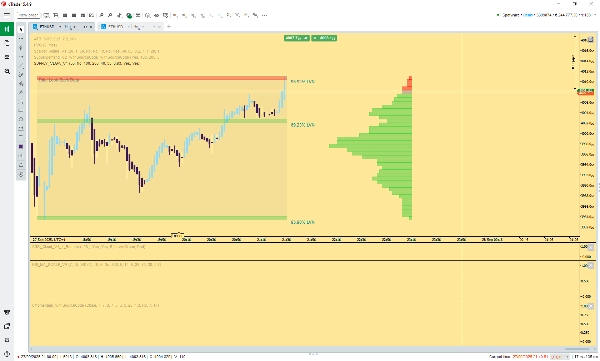
- การดูย้อนหลังแบบไดนามิก: โปรไฟล์จะปรับช่วงเวลาการวิเคราะห์โดยอัตโนมัติเพื่อมุ่งเน้นเฉพาะสวิงหรือแนวโน้มหลักปัจจุบัน โดยรีเซ็ตหลังจากจุดเปลี่ยนตลาดที่สำคัญ
- การระบายสีสัมพันธ์กับราคา: ฮิสโตแกรมโปรไฟล์ปริมาณที่มองเห็นได้และโซนอุปทาน/อุปสงค์ที่เกี่ยวข้องจะถูกระบายสีแบบไดนามิกตามราคาปัจจุบัน:
-
- สีเขียว: พื้นที่ปริมาณที่ต่ำกว่าราคาปัจจุบัน (ทำหน้าที่เป็นอุปสงค์/สนับสนุน)
- สีแดง: พื้นที่ปริมาณที่สูงกว่าราคาปัจจุบัน (ทำหน้าที่เป็นอุปทาน/ต้านทาน)
- ความแข็งแกร่งของ LVN: โซนจะถูกติดป้ายด้วยเปอร์เซ็นต์ที่แสดงถึงความอ่อนแอของปริมาณในระดับนั้น ซึ่งให้มาตรวัดเชิงวัตถุของความแข็งแกร่งเชิงทฤษฎีของโซน (ขนาดช่องว่างสภาพคล่อง)
เครื่องมือนี้จำเป็นสำหรับผู้ซื้อขายที่ใช้โครงสร้างตลาดขั้นสูง การไหลของคำสั่ง หรือเทคนิคโปรไฟล์ปริมาณเพื่อระบุจุดสนใจหลักและคาดการณ์การเปลี่ยนแปลงของตลาด
สรุป
สรุปโดย AI
The Institutional Volume Supply Demand indicator offers an advanced market structure analysis using Volume Profile Zones based on Volume at Price data. It automatically identifies key Support and Resistance levels by detecting Low Volume Nodes (LVNs), which represent areas where price moved rapidly with minimal trading volume, indicating potential future supply (resistance) and demand (support) zones. The indicator dynamically adjusts its look-back period to focus on the current major swing or trend, resetting after significant market pivots. It visually distinguishes supply and demand zones with color coding: green for volume areas below the current price (demand/support) and red for areas above (supply/resistance). Each LVN is labeled with a percentage that quantifies the weakness of volume at that level, providing an objective measure of zone strength based on liquidity void size. This tool supports traders employing advanced techniques such as order flow and Volume Profile analysis to identify high-probability market turning points. It is applicable across various markets including Forex pairs (e.g., EURUSD, GBPUSD, NZDUSD, USDJPY), cryptocurrencies (BTCUSD), indices (NAS100), and commodities (XAUUSD).
โปรไฟล์อินดิเคเตอร์
รีวิวจากลูกค้า
4.4
รีวิว: 5
5 | 80 % | |
4 | 0 % | |
3 | 0 % | |
2 | 20 % | |
1 | 0 % |
รีวิวจากลูกค้า
May 15, 2026
CTrader's recent update has made this indicator obsolete. It simply stops CTrader from working. this Indicator needs an update to correlate with the Ctrader update.
April 8, 2026
November 3, 2025
Excelente indicador para quem opera baseado em zonas de liquidez, oferta e demanda institucional. Ótimo trabalho!
การสนทนา
คำถามที่พบบ่อย
BTCUSD
Forex
Signal
Breakout
EURUSD
GBPUSD
NZDUSD
Bollinger
Fibonacci
ZigZag
Scalping
Fair Value Gap
SMC
Grid
AI
XAUUSD
NAS100
MACD
USDJPY
VWAP
ผลิตภัณฑ์ที่มีให้บริการผ่าน cTrader Store รวมถึงบอทการเทรด อินดิเคเตอร์ และปลั๊กอิน มีให้บริการโดยนักพัฒนาบุคคลที่สามและมีไว้เพื่อวัตถุประสงค์ในการเข้าถึงข้อมูลและทางเทคนิคเท่านั้น cTrader Store ไม่ใช่โบรกเกอร์และไม่ได้ให้คำแนะนำการลงทุน คำแนะนำส่วนบุคคล หรือการรับประกันผลการดำเนินงานในอนาคต


ราคา
ตั้งแต่ 09/01/2025
11.78K
ติดตั้งฟรี