Açıklama
Likidite Isı Haritası - Profesyonel Çok Zaman Dilimli Pivot Analizi
Gelişmiş likidite görselleştirmesi ile ticaretinizi dönüştürün. Bu güçlü gösterge, 10 farklı zaman dilimindeki pivot noktalarını aynı anda analiz ederek kurumsal likidite bölgelerini ortaya çıkarır ve akıllı paranın muhtemelen nerede konumlandığını gösteren dinamik bir ısı haritası oluşturur.
Nasıl Çalışır
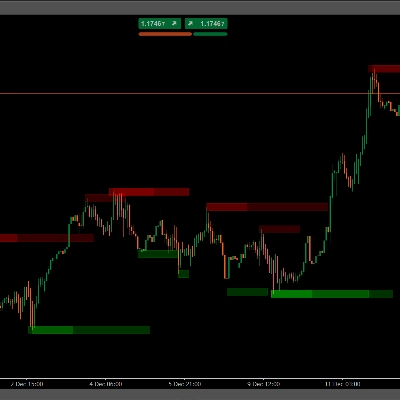
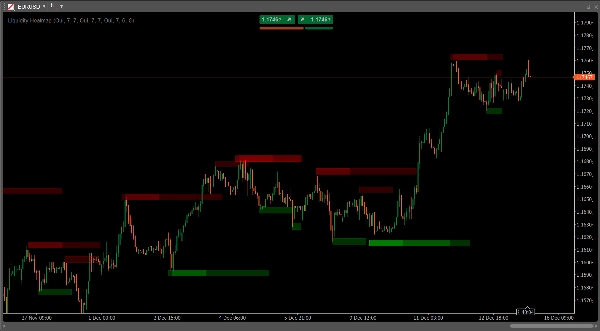
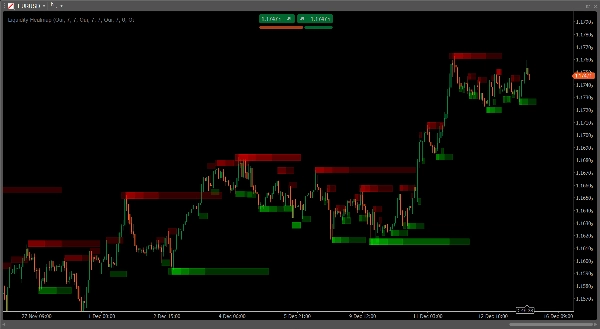
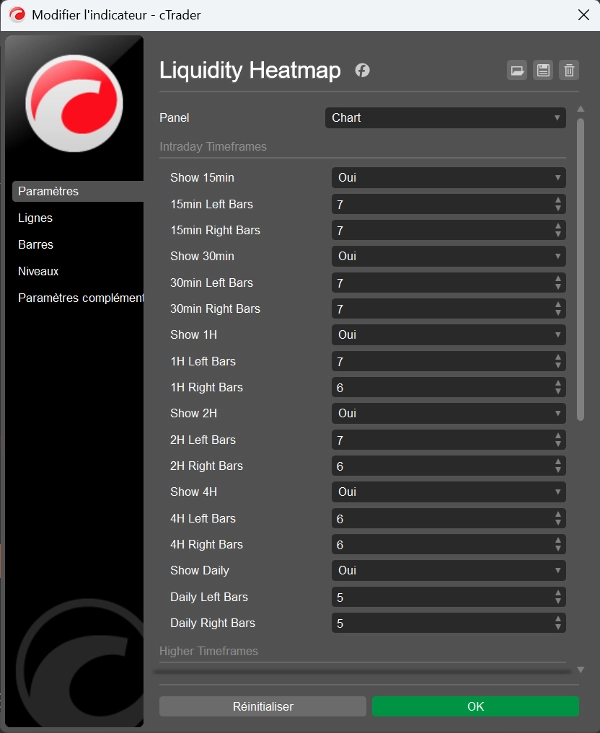
Gösterge, birden çok zaman diliminde (15dk, 30dk, 1S, 2S, 4S, Günlük, 8S, 3G, Haftalık, Aylık) pivot yüksek ve düşüklerini tespit eder ve her pivot seviyesinde yarı saydam bölgeler üst üste bindirir. Farklı zaman dilimlerinden birden fazla pivotun birleştiği yerlerde, bölgeler üst üste yığılır ve renk yoğunluğu artar, böylece grafiğinizde en güçlü likidite seviyelerini gösteren bir "ısı imzası" oluşturur.
Ana Özellikler
- 10 Özelleştirilebilir Zaman Dilimi: Aynı anda intraday (15dk) ile uzun vadeli (Aylık) perspektiflerden analiz yapın
- Akıllı Yoğunluk Haritalaması: Üst üste binen bölgeler otomatik olarak likidite birleşimini gösteren daha koyu alanlar oluşturur
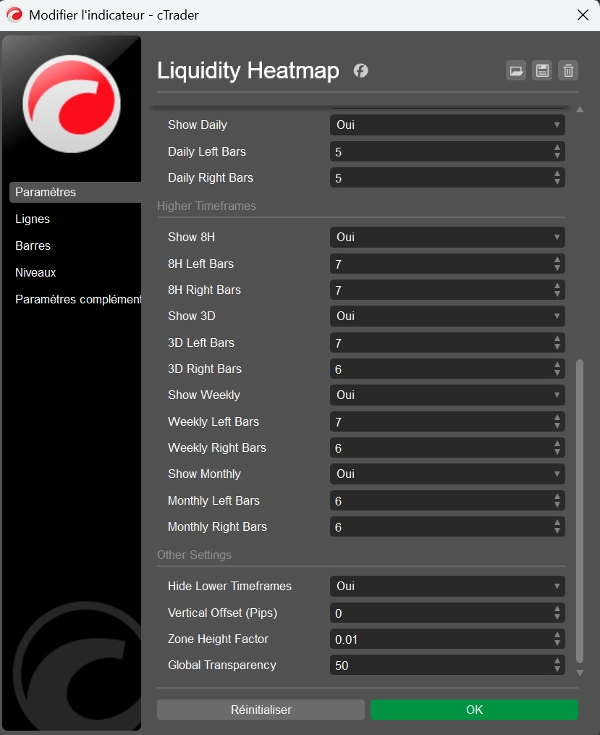
- Tamamen Ayarlanabilir Pivot Tespiti: Her zaman dilimi için bağımsız olarak sol/sağ barları (2-20) yapılandırın
- Uyarlanabilir Görselleştirme: Bölge yüksekliği, tutarlı görünüm için grafik yakınlaştırması ile otomatik olarak ölçeklenir
- Zamana Bağlı Bölgeler: Bölgeler, tam oluşum zamanlarına sabit kalır, grafikte asla kaymaz
- Özelleştirilebilir Şeffaflık: Grafik stilinize uygun küresel şeffaflığı (0-255) kontrol edin
- Akıllı Zaman Dilimi Filtreleme: Mevcut grafik görünümünüze göre alt zaman dilimlerini gizleme seçeneği
- Dikey Ofset Kontrolü: Pip bazlı ayarlama ile bölge konumlandırmasını ince ayarlayın
- Ayrı Renk Kodlaması: Pivot yüksekleri (direnç) için kırmızı bölgeler, pivot düşükleri (destek) için yeşil
İçin Mükemmel
- Likidite havuzlarını tanımlayan Akıllı Para Kavramları (SMC) tüccarları
- Kurumsal seviyeleri takip eden ICT metodolojisi takipçileri
- Yüksek olasılıklı dönüş bölgelerini bulan swing tüccarları
- Gün içi likidite yakalamalarını tanımlayan scalperlar
- Birden çok zaman diliminde birleşim arayan her tüccar
Ticaret Uygulamaları
Isı haritası, stop lossların nerede kümelendiğini ve kurumsal emirlerin muhtemelen nerede olduğunu ortaya çıkarır. Bu bölgeleri kullanarak:
- Likidite süpürmelerini ve dönüşleri önceden tahmin edin
- Güçlü destek/direnç birleşimlerini tanımlayın
- Likidite yakalamalarından sonra optimal giriş noktalarını bulun
- Ana likidite bölgelerinin ötesinde stratejik stop losslar belirleyin
- Likidite tüketimini gözlemleyerek kırılma geçerliliğini onaylayın
Bu Göstergeyi Öne Çıkaran Nedenler
Tek zaman dilimli seviyeleri gösteren temel pivot göstergelerinin aksine, bu ısı haritası 10 zaman diliminden aynı anda veri toplar ve size piyasa yapısının kapsamlı bir görünümünü sunar. Yoğunluk görselleştirmesi, hangi seviyelerin en önemli olduğunu anında gösterir - bölge ne kadar koyuysa, o likidite seviyesinde o kadar çok zaman dilimi hemfikirdir.
Performans Optimizasyonu
Akıllı nesne yönetimi ile zaman dilimi başına 500 bara kadar verimli şekilde işler, tüm zaman dilimleri etkinleştirildiğinde bile grafik performansının sorunsuz olmasını sağlar.
Kolay Kurulum
Optimize edilmiş varsayılan ayarlarla hemen kurun ve işlem yapmaya başlayın veya her parametreyi kendi stratejinize ve ticaret tarzınıza göre özelleştirin.
Likidite analizlerinizi yükseltin ve kurumsal emir akışının içgörüsüyle işlem yapın. Fiyatın rastgele hareket etmediğini, likiditeye doğru hareket ettiğini anlayan tüccarlar için mükemmeldir.
Özet
Key features include customizable pivot detection parameters for each timeframe, adaptive zone visualization that scales with chart zoom, and separate color coding for resistance (red) and support (green) zones. The indicator also offers adjustable transparency, vertical offset control, and smart timeframe filtering to hide lower timeframes based on the current chart view.
This tool is suitable for traders using Smart Money Concepts, ICT methodology, swing trading, scalping, or any strategy requiring multi-timeframe liquidity analysis. It helps identify clusters of stop losses and institutional orders to anticipate liquidity sweeps, reversals, strong support/resistance levels, optimal entry points, strategic stop losses, and breakout confirmations.
Liquidity Heatmap efficiently processes up to 500 bars per timeframe with optimized object management, ensuring smooth performance. It supports various markets including Forex, Crypto, Stocks, Indices, and Commodities. The indicator comes with optimized default settings and full customization options to fit different trading styles.
Müşteri değerlendirmeleri
5 | 100 % | |
4 | 0 % | |
3 | 0 % | |
2 | 0 % | |
1 | 0 % |