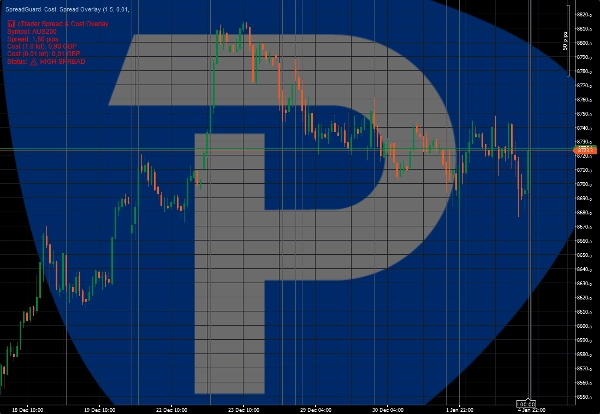
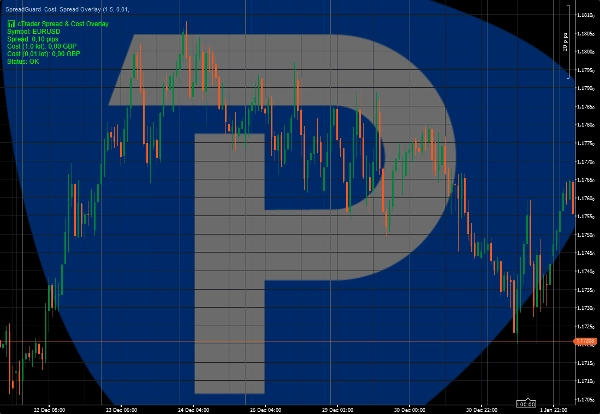
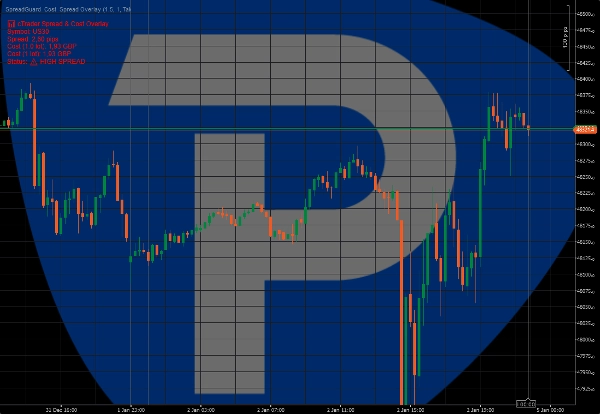
شعار "SpreadGuard  Cost  Spread Overlay"
SpreadGuard Cost Spread Overlay
صورة "SpreadGuard  Cost  Spread Overlay" المحملة
منذ 02/01/2026

cTrader Spread & Cost Overlay is a lightweight indicator designed to visualize real-time trading costs directly on the chart.

The indicator shows the current spread in pips and calculates the estimated cost of a trade based on the selected lot size. A visual warning highlights periods of high spread, helping traders avoid unfavorable execution conditions.

Key features:
• Live spread display (pips)
• Estimated trade cost for selected lot size
• Visual warning when spread exceeds a defined threshold
• Clean on-chart overlay

This indicator does not place trades or generate trading signals.
It is intended as an execution and risk-awareness tool for manual traders.

Suitable for scalpers, intraday traders, and prop firm accounts.

*Early access price. Future updates may be released at a higher regular price.

Indicator profile
0.0
التقييمات: 0
تقييمات العملاء
لا توجد تقييمات لهذا المنتج حتى الآن. هل جرَّبته بالفعل؟ كن أول من يخبر الآخرين!
Prop
Forex
EURUSD
ATR
GBPUSD
Products available through cTrader Store, including trading bots, indicators and plugins, are provided by third-party developers and made available for informational and technical access purposes only. cTrader Store is not a broker and does not provide investment advice, personal recommendations or any guarantee of future performance.

المزيد من هذا المؤلف

Visual session structure showing Asia, London and New York high/low ranges directly on the chart.
Visual warning zones for high-impact news so you can manage risk before volatility hits.

قد يعجبك أيضًا

LevelMaster S/R: Pinpoint key support & resistance zones with precision. Perfect for traders of all levels Trade smarter
Precision ICT indicator detecting NWOG, NDOG & EHPDA for high-probability institutional trading setups.
Identify high-probability reversal zones by detecting SMT divergences between correlated pairs in real time
Z-Score: Measures price deviations from its mean. Spots overbought/sold (±2-3 SD) & reversals. Key for stats trading
Multi-TF OHLC, NY Midnight, ZigZag & Gann S/R—clean visuals for SMC, scalping, and intraday precision.
Volatility-weighted cloud with adaptive bands and UP/DOWN tags for timing trends, pullbacks, and breakouts.
شعار "HA"
$ 19
Pro Heikin Ashi Visual Overlay – Clean Trend Visualization
VWAP (Volume Weighted Average Price, Precio Promedio Ponderado por Volumen)
RSI, MACD, Stochastic, CCI & Momentum divergence scanner with confluence scoring. Never miss a signal again!
IVB 2.0 is an indicator that works on the strategy of imbalance of the maximum volatility box of indices
A powerful overlay tool designed to automatically plot Fibonacci retracement levels based on a custom window.
Auto-marks key Highs/Lows. Spot swing points & market structure instantly. Fully customizable for any timeframe.
MarketStructureOscSignals is a pure price-action signal tool.
Track major trading sessions (Tokyo, London, New York) with customizable colors and visual session highlights on your ch
Trading indicator designed to give you the edge by accurately identify critical support and resistance levels.
This indicator is designed to display customizable moving averages (MAs) on a chart.
منذ 02/01/2026