
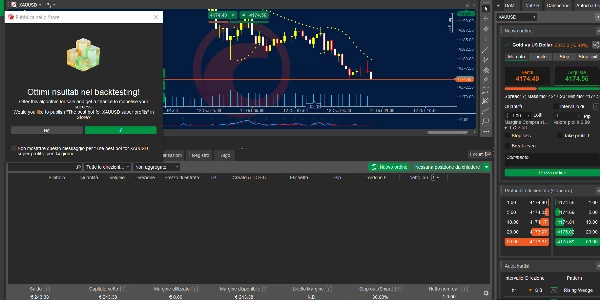
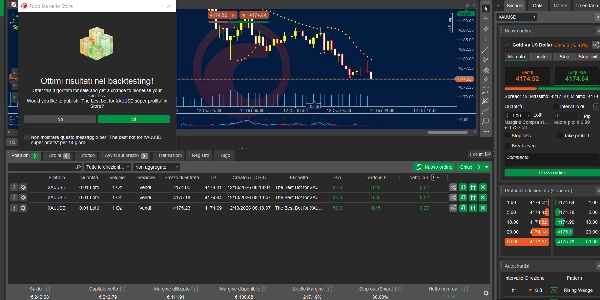
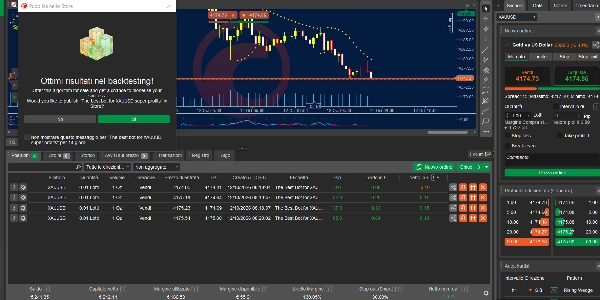
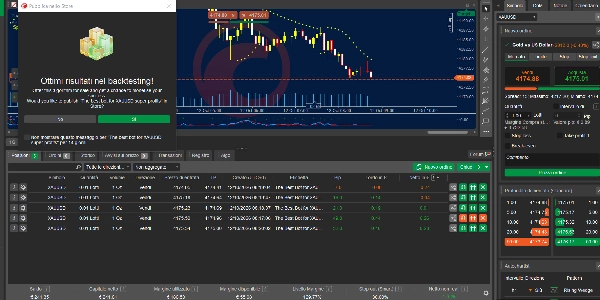
คำอธิบาย
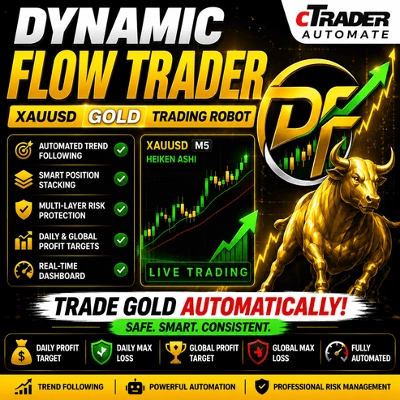
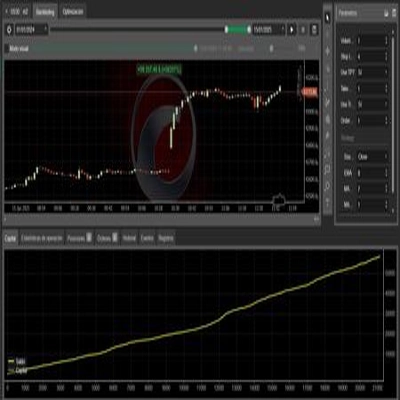
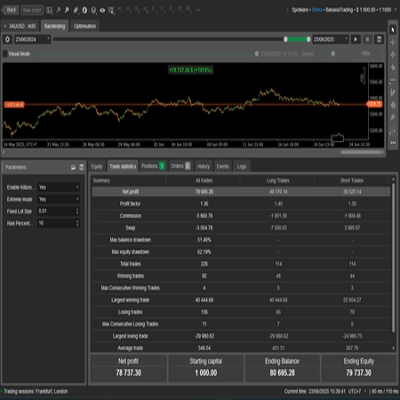
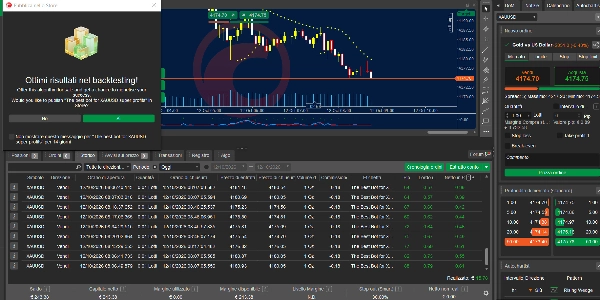
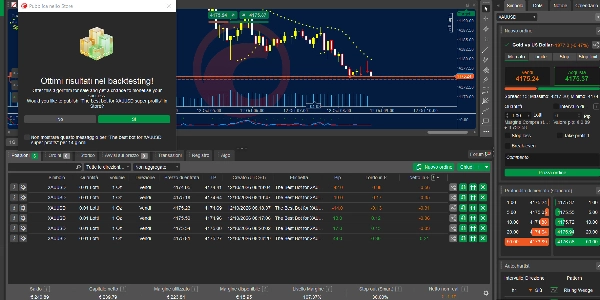
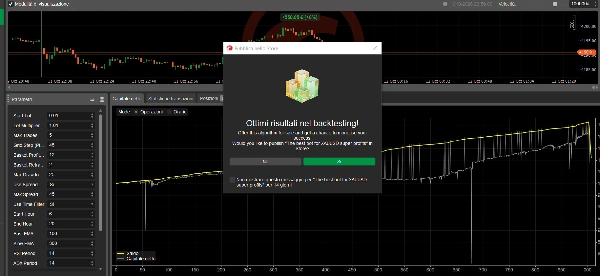
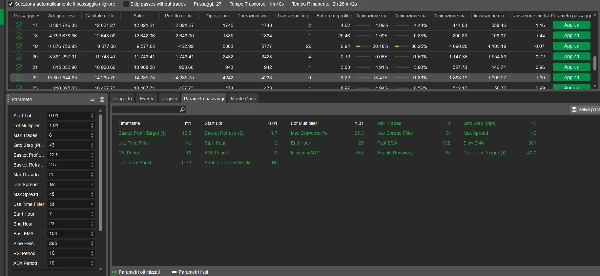
The best bot for XAUUSD super profits
“ATTENTION”: TRY IT BEFORE YOU BUY IT
Subscriptions are available—for one week, one month, or six months—via the personal area.
A 5-day free trial version is available; if it is not listed in the store,
simply contact me with your c Trader account number and the name of the cBot you wish to test.
At the end of the trial period, if the robot meets your needs, you can purchase the full version directly from the cTrader Store.
Contact me to request your free trial.
Please note that the c Bot may take some time to execute trades, as it waits for ideal market conditions and the occurrence of internal signals defined in its logic.
The best high-profit bot for XAUUSD
Automated trading system on cTrader for XAUUSD and BTCUSD H1 timeframe
Overview
This systematic algorithmic trading c Bot is designed for the c Trader platform. It relies on a structured, trend-oriented logic focused primarily on XAUUSD (Gold), while also supporting BTCUSD as an optional secondary market.
The strategy combines multi-level technical analysis—including trend direction via EMA, momentum confirmation via RSI, and strength filtering via ADX—to ensure trades are executed only when the market exhibits a defined directional structure. ⚙️ Core Strategy Logic
The bot operates within a rigorous, institutional-style framework:
Trend detection: structure based on the crossover of the 100-period and 300-period EMAs
Momentum confirmation: directional validation based on RSI
Trend strength filter: strength and volatility thresholds based on ADX
🔁 Grid execution logic: controlled position scaling with specific spacing rules
Basket management: profit consolidation via basket Take Profit (TP) and protection against retracements
Risk control: drawdown protection and spread filtering
The system is designed to avoid overtrading and operates only when conditions align with directional momentum.
🪙 Target Markets
XAUUSD (Primary market)
Optimized for gold volatility on lower timeframes (M5), featuring adaptive entry sensitivity.
BTCUSD (Secondary market)
Optional execution mode adapted to the higher volatility and dynamics of the cryptocurrency market. 🧠 Operational Philosophy
The bot employs a structured, non-random approach:
Operates exclusively during confirmed trends
Avoids sideways or low-quality market phases
Gradually scales positions within defined risk limits
Prioritizes capital preservation over capital expansion
⚠️ Risk Warning
Trading leveraged products—such as Forex, CFDs, and cryptocurrencies—involves significant risk and can result in the partial or total loss of capital. This software is an automated trading tool and does not guarantee profits. Past performance is not indicative of future results.
Users are solely responsible for configuring and monitoring their risk exposure. It is recommended to test the system on a demo account before using it in a live environment.
📋 REVERSE MODE - COMPLETE DESCRIPTION
🎯 WHAT IS REVERSE MODE?
Reverse Mode is a feature that completely inverts the trading signals generated by the robot. When activated, the robot will do the opposite of what it would normally do:
- BUY SIGNAL → Executes a SELL
- SELL SIGNAL → Executes a BUY
📊 WHEN TO ACTIVATE REVERSE MODE
✅ 1. INVERTED MARKET TREND
When the market is moving in the opposite direction compared to indicators:
IndicatorNormal SignalReverse Mode
EMA Fast > Slow
BUY
SELL
RSI > 50
BUY
SELL
High ADX
Strong Trend
Inverted Trend
Example: If indicators show a bullish trend but price is falling due to news/fundamentals.
✅ 2. MARKET CORRECTIONS
During temporary corrections within a main trend:
text
Main Trend: 📈 BULLISH
Correction: 📉 Temporary Pullback
Reverse Mode: 🔄 Inverts signal to capture the correction
When to use:
- After strong directional movements
- During Fibonacci retracements (38.2% - 61.8%)
- When RSI/MACD divergences appear
✅ 3. RANGE-BOUND MARKET (CONSOLIDATION)
In sideways/range markets where normal signals generate false breakouts:
text
Condition: Price in Range (consolidation)
Normal Signal: False breakouts → Losses
Reverse Mode: Captures rebounds at range boundaries
Identification:
- Bollinger Bands narrowing
- ADX declining (< 20)
- Price oscillating between support and resistance
✅ 4. AFTER MAJOR ECONOMIC NEWS
Following news releases that cause excessive reactions:
EventReactionReverse Mode Action
NFP
Price spike
Counter-trend trade
FOMC
Extreme volatility
Capture mean reversion
CPI
Sharp movement
"Sell the rally" strategy
Example: After a positive NFP, if price rises too fast, Reverse Mode can capture the retracement.
✅ 5. OVERTREND (EXTENDED MARKET)
When the market is overbought/oversold:
text
RSI > 70 (Overbought) → Reverse Mode SELL
RSI < 30 (Oversold) → Reverse Mode BUY
Warning signs:
- RSI > 75 or < 25 on 15m/1h timeframe
- Extreme distance from EMAs
- Declining volume during the trend
🚫 WHEN NOT TO USE REVERSE MODE
❌ 1. STRONG, CLEAR TREND
text
Condition: Strong trend with ADX > 30
Normal Signal: ✅ Profitable
Reverse Mode: ❌ Counter-trend → Losses
❌ 2. NORMAL MARKET VOLATILITY
If the market is moving in an orderly and predictable way, Reverse Mode may reduce profits.
❌ 3. WITHOUT REVERSAL CONFIRMATIONS
Don't activate based on "feeling." Use technical confirmations:
- RSI/MACD divergences
- Candlestick patterns (Doji, Engulfing)
- Trendline breaks
📈 PRACTICAL EXAMPLES
Scenario 1: Bullish Market with Correction
text
📊 Market Data:
- EURUSD in uptrend from 1.1000 to 1.1500
- Correction to 1.1300
- RSI = 55 (neutral)
- ADX = 28 (moderate trend)
🤖 Normal Signal: BUY (trend confirmation)
🔄 Reverse Mode: SELL (capture correction)
📌 When to use: If correction has just started and
there are continuation signals (e.g., Doji, Hammer)
Scenario 2: Sideways Range
text
📊 Market Data:
- XAUUSD between 1950 and 1970 for 3 days
- RSI = 65
- ADX = 18 (weak)
- Consolidation flags
🤖 Normal Signal: BUY (RSI > 50)
🔄 Reverse Mode: SELL (price near resistance)
📌 When to use: Price near the upper range boundary
Scenario 3: After News Event
text
📊 Market Data:
- NFP Release: +250K jobs (better than expected)
- Price spikes up 50 pips in 5 minutes
- RSI jumps to 78 (overbought)
- ADX spikes to 45 (extreme)
🤖 Normal Signal: BUY (momentum)
🔄 Reverse Mode: SELL (overreaction, mean reversion)
📌 When to use: Price has overreacted and is
showing signs of exhaustion
Scenario 4: Divergence Confirmation
text
📊 Market Data:
- Price making higher highs
- RSI making lower highs
- MACD showing bearish divergence
- ADX declining from 32 to 21
🤖 Normal Signal: BUY (price higher highs)
🔄 Reverse Mode: SELL (divergence suggests reversal)
📌 When to use: Divergence confirmed on 2+ indicators
🛠️ RECOMMENDED CONFIGURATION
For Reverse Mode Setup:
text
Start Lot: 0.01 (or reduce by 50%)
Lot Multiplier: 1.01 (normal)
Max Trades: 3-5 (reduce if uncertain)
Grid Step: 45-60 pips (increase for false signals)
Basket TP: $8-10 (reduce for counter-trend)
Activation Signals Checklist:
- □
ADX declining from high levels (> 40) - □
RSI near 70/30 with reversal candle - □
Price near key support/resistance - □
RSI/MACD divergence confirmed - □
Volume decreasing during trend - □
Candlestick reversal patterns - □
Price at Fibonacci extension levels - □
Multiple timeframe alignment
📊 COMPARISON TABLE
Market ConditionReverse Mode?Reasoning
Strong trend with ADX > 30
❌ NO
Trend is reliable
Sideways/Range market
✅ YES
Captures rebounds
Correction in uptrend
✅ YES
Captures retracement
After major news
✅ YES
Mean reversion opportunity
RSI overbought/oversold
✅ YES
Counter-trend trading
Confirmed breakout
❌ NO
Follow the breakout
High timeframe (D1/W1)
❌ NO
Trends are more reliable
Low timeframe (M1/M5)
✅ YES
More noise, false signals
Market manipulation
✅ YES
Fade the move
Gap openings
✅ YES
Fill the gap
🎯 ACTIVATION STEP-BY-STEP PROCESS
text
Step 1: 📊 Identify the Market Phase
↓
Step 2: 📈 Check Technical Indicators
↓
Step 3: 🔍 Look for Reversal Signals
↓
Step 4: ✅ Confirm with Multiple Timeframes
↓
Step 5: 🔄 Activate REVERSE MODE
↓
Step 6: 📉 Execute Counter-Trend Position
↓
Step 7: 🎯 Set Realistic Targets
↓
Step 8: 🛑 Place Protective Stop Loss
↓
Step 9: 👁️ Monitor Closely
↓
Step 10: ⏰ Deactivate When Conditions Change
📝 TRADING JOURNAL CHECKLIST
Before Activating Reverse Mode:
- □
Market is in consolidation or correction - □
ADX is below 25 (trend weakening) - □
RSI shows divergence - □
Price at key support/resistance - □
Reversal candlestick pattern present - □
Volume confirming reversal - □
No major news expected in next 2-3 hours - □
Multiple timeframe alignment
While Using Reverse Mode:
- □
Monitor positions more frequently - □
Reduce position size by 30-50% - □
Set tighter stop losses - □
Take profits quicker - □
Watch for trend resumption signals
Deactivate Reverse Mode When:
- □
Trend resumes with ADX > 30 - □
Price breaks key level - □
RSI returns to normal range - □
After 2-3 losing trades in a row - □
Market conditions change - □
Strong momentum returns
สรุป
Key features include controlled position scaling with grid logic, basket profit locking with take-profit and retrace protection, and risk controls such as drawdown limits and spread filtering. It is optimized for gold volatility on lower timeframes (M5) and adapts to the higher volatility of cryptocurrency markets when BTCUSD mode is enabled.
Risk management is integral, with recommended settings including 1.2% risk per trade, a maximum balance drawdown of 2.24%, and a daily drawdown limit of 5%. The bot supports up to two simultaneous positions and is designed to prioritize capital preservation while seeking consistent returns. Users are advised to test the bot on demo accounts before live deployment. A free 14-day trial is available upon request.
รีวิวจากลูกค้า
5 | 0 % | |
4 | 0 % | |
3 | 100 % | |
2 | 0 % | |
1 | 0 % |