คำอธิบาย
ตัวบ่งชี้ Professional Footprint & Delta สำหรับ cTrader
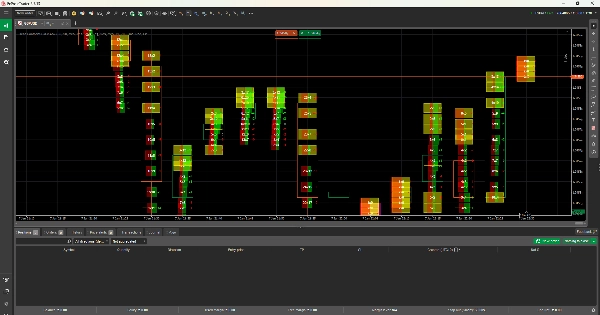
ตัวบ่งชี้ Footprint สำหรับ cTrader นี้อ่าน ข้อมูล tick จริง เพื่อแสดงว่าผู้ซื้อและผู้ขายมีปฏิสัมพันธ์อย่างไรในแต่ละระดับราคา มันแสดง ปริมาณ, delta ของ bid/ask, และความไม่สมดุล ช่วยให้นักเทรดเห็นอย่างชัดเจนว่าใครเป็นฝ่ายควบคุมตลาด
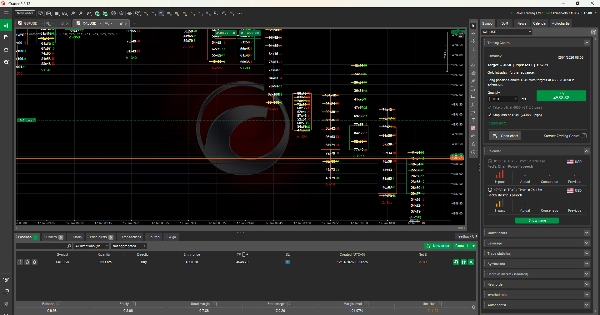
สร้างขึ้นโดยใช้ แนวคิด Market Profile และ Volume Profile ตัวบ่งชี้นี้เน้นพื้นที่ที่มีกิจกรรมสูง, โซนมูลค่า, และแนวรับหรือแนวต้านที่แข็งแกร่ง แทนที่จะเดาจากราคาเพียงอย่างเดียว นักเทรดสามารถตัดสินใจโดยอิงจาก ปริมาณการซื้อขายจริงและการไหลของคำสั่ง.
เหมาะสำหรับการ scalping และการเทรดภายในวัน เครื่องมือนี้มอบความได้เปรียบระดับมืออาชีพให้กับผู้ใช้ cTrader โดยเปิดเผยเรื่องราวที่แท้จริงเบื้องหลังการเคลื่อนไหวของราคา
ตัวบ่งชี้นี้ช่วยให้คุณเข้าใจ สิ่งที่เกิดขึ้นจริงภายในแต่ละแท่งเทียน มันอ่านข้อมูล tick และแสดงจำนวนผู้ซื้อและผู้ขายที่ซื้อขายในแต่ละราคา
คุณสามารถเห็นได้อย่างชัดเจนว่า:
- จุดที่ผู้ซื้อแข็งแกร่งกว่า
- จุดที่ผู้ขายแข็งแกร่งกว่า
- เมื่อโมเมนตัมเพิ่มขึ้นหรือลดลง
ตัวบ่งชี้ยังแสดง delta ซึ่งหมายถึงความแตกต่างระหว่างแรงกดดันซื้อและขาย มันถูกสร้างขึ้นโดยใช้ Market Profile และ Volume Profile ดังนั้นคุณจึงสามารถสังเกตเห็นพื้นที่ราคาสำคัญที่ตลาดตอบสนองได้อย่างง่ายดาย
สิ่งนี้ทำให้การเทรดง่ายขึ้นสำหรับผู้เริ่มต้นเพราะคุณไม่ต้องเดา คุณสามารถเห็น ปริมาณจริงและกิจกรรมตลาดจริง ไม่ใช่แค่ตัวบ่งชี้ที่อิงจากราคาเท่านั้น