Jangan hanya berdagang di pasar. Bacalah Pulse.
BORIS QUANTUM PULSE: Keunggulan Institusional
Berhenti berdagang melawan "Uang Besar" dan mulailah mengikuti jejak mereka.
Kebanyakan trader ritel kalah karena mereka masuk pasar saat pergerakan sudah berakhir. Boris Quantum Pulse dirancang untuk mengatasi hal itu. Dibangun berdasarkan prinsip Aliran Pesanan Institusional, indikator ini mengidentifikasi "Celah" dalam aksi harga—zona spesifik di mana bank dan institusi telah menyuntikkan likuiditas besar, meninggalkan pasar dalam keadaan tidak seimbang.
Ketika pasar meninggalkan celah, hampir selalu kembali untuk "mengisinya". Quantum Pulse menangkap momen-momen ini secara real-time, memberi Anda peta jalan dengan probabilitas tinggi tentang ke mana harga akan bergerak selanjutnya.
Fitur Utama
- Analisis Aliran Real-Time: Segera mengidentifikasi ketidakseimbangan institusional (Celah) saat terbentuk.
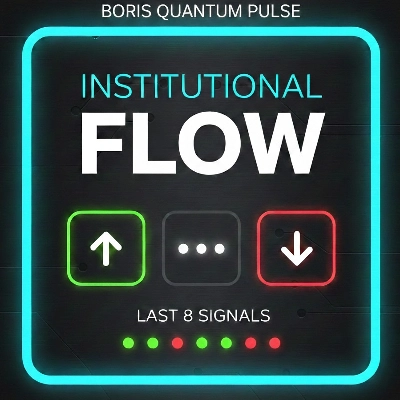
- Strip Riwayat "Roulette": Dashboard visual yang ramping menunjukkan 8 sinyal terakhir secara sekilas. Jika lampu sebagian besar Merah, para bear menguasai; jika Hijau, para bull sedang beraksi.
- Pemetaan Visibilitas Tinggi: Tidak perlu lagi menyipitkan mata pada grafik. Kotak "High-Vis" baru kami dengan batas tegas dan warna cerah jelas mendefinisikan zona institusional.
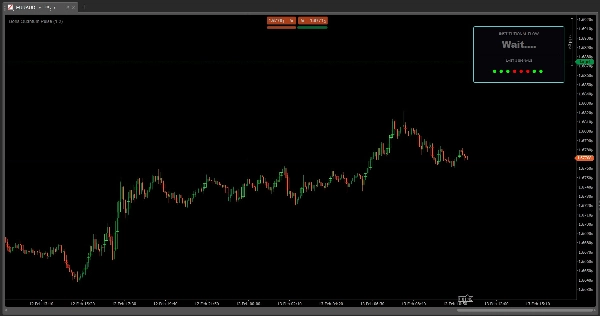
- Mesin Status Adaptif: Panel "Aliran Institusional" memberi tahu Anda persis apa yang harus dilakukan: TUNGGU untuk setup atau AKSI sinyal.
Cara Menguasai Parameter
Keindahan Boris Quantum Pulse adalah kesederhanaannya, tetapi Parameter memungkinkan Anda menyesuaikannya dengan gaya trading spesifik Anda.
1. Min Gap (Pips)
- Fungsinya: Menetapkan "loncatan" minimum harga yang diperlukan untuk memicu sinyal institusional.
- Cara menggunakannya: * Scalping (grafik 1m - 5m): Atur lebih rendah (misalnya, 0.5 hingga 1.0) untuk menangkap lonjakan institusional kecil dan cepat.
-
- Swing Trading (grafik 1h - 4h): Atur lebih tinggi (misalnya, 2.0 hingga 5.0) untuk menyaring noise dan hanya menangkap pergeseran pasar utama.
2. Sinergi Timeframe
Meskipun bukan pengaturan dalam kode, indikator ini beradaptasi dengan semua timeframe. Gunakan pada grafik 15 menit untuk keseimbangan sempurna antara frekuensi sinyal dan akurasi.
Cara Berdagang dengan Boris Quantum Pulse
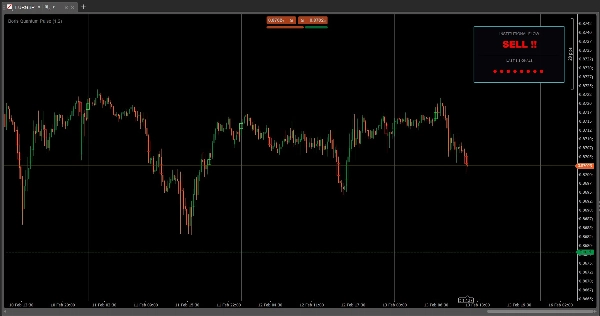
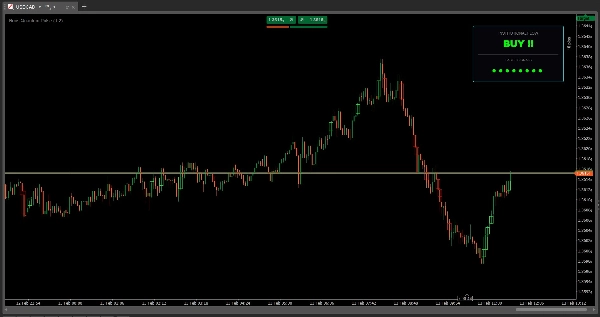
- Identifikasi Zona: Tunggu kotak Hijau (Beli) atau Merah (Jual) muncul di grafik Anda.
- Periksa Pulse: Lihat strip 8 Sinyal Terakhir. Apakah pemain institusional secara konsisten mendorong ke satu arah?
- Entri: * Breakout: Masuk segera setelah status "BELI !!" atau "JUAL !!" muncul.
-
- Retest: Tunggu harga kembali dan menyentuh kotak visibilitas tinggi (pengisian "Celah") untuk stop-loss yang lebih ketat dan rasio risiko:imbalan yang lebih tinggi.
- Keluar: Ikuti aliran sampai Pulse mulai memudar atau sinyal berlawanan muncul.
Mengapa Memilih Boris Quantum Pulse?
Di dunia indikator yang tertinggal seperti RSI dan MACD, Quantum Pulse adalah indikator terdepan. Ini tidak memberi tahu Anda apa yang terjadi sepuluh candle lalu; ini memberi tahu Anda di mana uang institusional berada saat ini juga.
Jangan hanya berdagang di pasar. Bacalah Pulse.
5 | 100 % | |
4 | 0 % | |
3 | 0 % | |
2 | 0 % | |
1 | 0 % |


