KST Momentum Heatwave — Trasforma il Momentum nella Temperatura del Mercato (Sullo Schema)
✅ Motore KST moderno con impostazioni predefinite ottimizzate (10/15/20/30 + 10/10/10/15, Segnale 9)
✅ Sovrapposizione del prezzo reale — KST + Segnale sono proiettati direttamente sul grafico attorno a una EMA di base
✅ 4 Modalità Visive: Pro Smooth / Classico / Raw Heat / Two Tier
✅ Mappa di Calore del Momentum + Bagliore per visualizzare la forza istantaneamente
✅ Forza del momentum normalizzata per coerenza tra simboli e intervalli temporali
✅ Sistema di isteresi anti-chop per filtrare il rumore nei mercati laterali
Questo non è un oscillatore tradizionale.
KST Momentum Heatwave trasforma il classico indicatore Know Sure Thing (KST) in un sistema visivo di temperatura del momentum costruito direttamente sul tuo grafico.
Invece di osservare un oscillatore sotto il grafico, il momentum diventa uno strato dinamico sopra il prezzo — mostrando direzione, forza e ciclo di vita del momentum in modo che possa essere interpretato immediatamente.
Cosa fa l'indicatore e a cosa è destinato
KST Momentum Heatwave converte i dati di momentum in una mappa visiva della temperatura della pressione di mercato.
Gli oscillatori tradizionali richiedono ai trader di spostare costantemente l'attenzione tra il grafico dei prezzi e una finestra indicatore separata.
Questo indicatore elimina tale attrito proiettando il momentum direttamente sul grafico dei prezzi stesso.
Il risultato è un flusso di lavoro più pulito dove puoi vedere immediatamente:
- quando il momentum sta accelerando
- quando una tendenza è forte e dominante
- quando il momentum sta raffreddandosi
- quando il mercato entra in una fase di movimento laterale a bassa energia
È progettato per trader che vogliono identificare rapidamente:
- forza della tendenza
- opportunità di continuazione del momentum
- esaurimento del momentum
- cambiamenti di regime
Invece di indovinare se un movimento ha forza dietro, KST Momentum Heatwave rende visibile quella pressione.
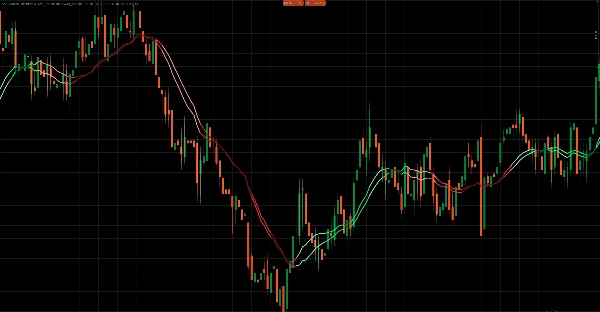
Cosa traccia sul grafico e come leggerlo
L'indicatore traccia due linee di momentum direttamente sul grafico dei prezzi, insieme a uno strato visivo di calore.
1. Linea KST — Nucleo del Momentum
La linea principale del momentum calcolata da quattro componenti ROC ponderate.
Interpretazione:
- KST sopra il Segnale → momentum rialzista
- KST sotto il Segnale → momentum ribassista
La distanza tra le due linee indica l'intensità del momentum.
2. Linea Segnale — Innesco del Momentum
Una media mobile smussata della linea KST.
Agisce come linea di innesco del momentum.
- Gli incroci tra KST e Segnale spesso indicano cambiamenti o accelerazioni del momentum.
3. Strato di Calore del Momentum
L'indicatore converte la distanza tra KST e Segnale in un valore di forza normalizzato tra 0 e 1.
Questo valore determina l'intensità del colore e la visualizzazione della mappa di calore.
Interpretazione:
- Colori brillanti/chiari → momentum forte
- Colori normali → pressione di tendenza stabile
- Colori scuri → momentum in indebolimento
- Colori che svaniscono → possibile rallentamento o transizione
Effetti opzionali di mappa di calore e bagliore colorano le candele stesse, permettendo ai trader di vedere immediatamente quando il mercato si sta “riscaldando.”
4. Strato di Proiezione del Prezzo
Invece di tracciare valori grezzi dell'oscillatore, l'indicatore proietta il momentum sul prezzo usando:
- una EMA di base
- un' ampiezza scalata ATR
Questo mantiene la sovrapposizione proporzionale al grafico e assicura che l'indicatore rimanga leggibile su diversi mercati e intervalli temporali.
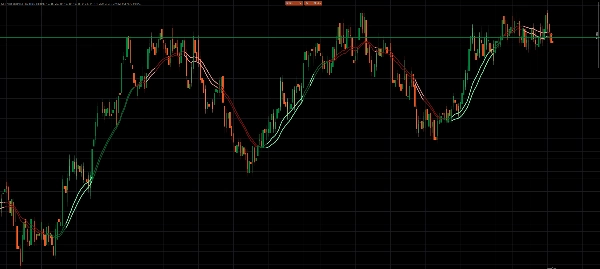
Modalità visive e comportamento
KST Momentum Heatwave include quattro stili visivi che cambiano il modo in cui il momentum viene interpretato.
Pro Smooth
La modalità più avanzata.
Caratteristiche:
- colorazione del momentum basata sul ciclo di vita
- filtraggio con isteresi
- requisiti di conferma prima del cambio di direzione
Questo riduce significativamente il rumore durante mercati laterali o agitati.
Classico
Usa la colorazione del ciclo di vita senza filtraggio con isteresi.
Risultato:
- risposte del momentum più rapide
- leggermente più sensibile alle fluttuazioni di mercato
Ideale per trading intraday e swing.
Raw Heat
Si concentra esclusivamente sulla forza assoluta del momentum.
Il momentum è categorizzato in tre livelli:
- forte
- medio
- debole
Questa modalità è ideale per trader che vogliono una lettura pura della potenza del momentum.
Two Tier
Una modalità di interpretazione semplificata.
- KST sopra/sotto il Segnale definisce la direzione
- una soglia di forza definisce momentum forte vs debole
Progettato per trader che preferiscono complessità visiva minima.
Come usare KST Momentum Heatwave
Passo 1 — Seleziona la tua modalità visiva
Usa la modalità che corrisponde al tuo stile di trading:
- Pro Smooth → segnali più puliti in mercati rumorosi
- Classico → reazioni più rapide
- Raw Heat → focus sulla forza del momentum
- Two Tier → interpretazione semplice forte vs debole
Passo 2 — Identifica il regime di momentum
Cerca il comportamento dominante del colore:
- Colori rialzisti dominanti → bias long
- Colori ribassisti dominanti → bias short
- Colori scuri che svaniscono → momentum in indebolimento
- Frequenti cambi di colore → probabilmente condizioni laterali
Passo 3 — Usa il momentum per il timing delle operazioni
I casi d'uso tipici includono:
Continuazione della tendenza
Entra durante i ritracciamenti quando il regime di momentum rimane intatto e la forza resta elevata.
Esaurimento del momentum
Riduci l'esposizione quando i colori si scuriscono e la forza diminuisce.
Inversione del momentum
Osserva i cambiamenti KST/Segnale combinati con un aumento della forza.
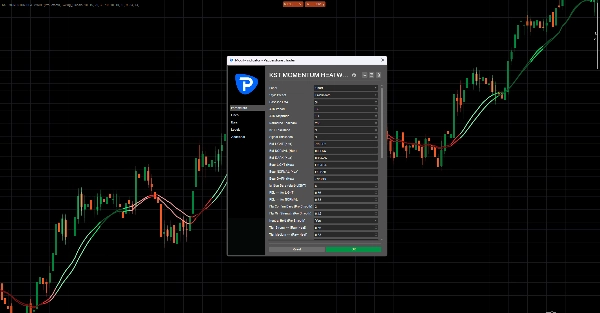
Esempio di configurazione consigliata
Una configurazione bilanciata per la maggior parte dei mercati:
Preset: Swing_Classic
Modalità Visiva: Pro Smooth
EMA di base: 34
Periodo ATR: 14
Ampiezza ATR: 1.40
Lookback Normalizzato: 200
Mappa di Calore: Abilitata
Bagliore: Abilitato
Mercati e intervalli temporali consigliati
Poiché l'indicatore utilizza scaling ATR e forza normalizzata, si adatta bene alla maggior parte dei mercati.
Funziona particolarmente bene su:
Forex
- M5 – H1 per trading intraday
- H1 – H4 per swing trading
Indici
- M1 – M15 per scalping di momentum
- M15 – H1 per trading strutturato di tendenza
Crypto
- M5 – H1 (consigliato Pro Smooth)
- H1 – H4 per ambienti di tendenza
Commodity
- M15 – H4
Gli intervalli temporali inferiori beneficiano maggiormente del filtraggio Pro Smooth.
Parametri chiave e cosa controllano
Sistema preset
I preset Scalp_Clean, Swing_Classic, Smooth e Aggressive regolano la configurazione interna del KST.
La modalità personalizzata consente il controllo manuale completo.
Normalizzazione del momentum
Normalize Lookback
Controlla la finestra storica utilizzata per scalare la forza del momentum.
Valori più alti producono letture più fluide.
Proiezione della sovrapposizione
Baseline EMA
Definisce la linea di ancoraggio usata per proiettare la sovrapposizione del momentum.
ATR Amplitude
Controlla quanto la sovrapposizione si espande dalla linea di base.
Controlli anti-chop (Pro Smooth)
Flip Confirm Bars
Numero di barre richieste per confermare un cambio di regime.
Flip Min Strength
Forza minima del momentum richiesta prima di accettare un cambio.
Neutral Hold
Aiuta a stabilizzare il regime durante condizioni di momentum debole.
Visualizzazione di calore e bagliore
Controlla quanto fortemente la mappa di calore reagisce alla forza del momentum.
I parametri includono:
- Larghezza del Calore
- Alfa del Calore
- Gamma del Calore
- Forza del Bagliore
Gestione delle prestazioni
Keep Bars
Limita quanti oggetti visivi rimangono sul grafico per mantenere l'indicatore fluido.
Note importanti
Intensità degli oggetti sul grafico
Gli effetti di mappa di calore e bagliore disegnano più oggetti.
Se le prestazioni rallentano:
- riduci KeepBars
- riduci la Larghezza del Calore
- disabilita il Bagliore
Saturazione della forza
Picchi di volatilità estrema possono portare rapidamente la forza vicino al massimo.
Se ciò accade:
- aumenta Normalize Lookback
- passa alla modalità Pro Smooth
Migliore se usato con la struttura
KST Momentum Heatwave è progettato come uno strato di regime del momentum, non come generatore di segnali autonomo.
Per i migliori risultati combinalo con:
- supporti e resistenze
- struttura di mercato
- zone di liquidità
- analisi di tendenza


