

Descrizione
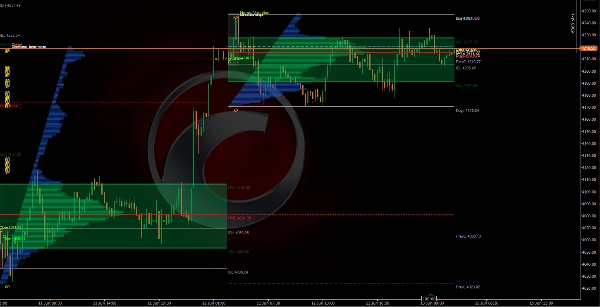
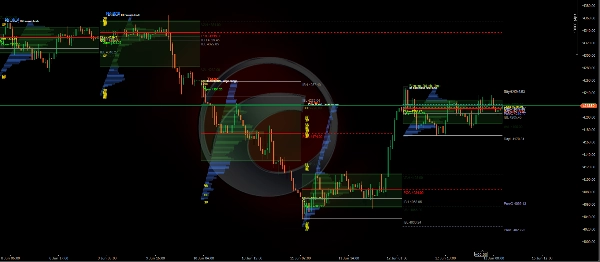
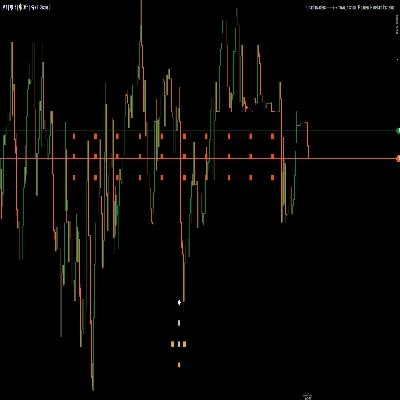
Market Profile TPO v4 porta l'analisi Market Profile in stile istituzionale direttamente sui tuoi grafici cTrader. L'indicatore costruisce profili Time Price Opportunity (TPO) per ogni sessione di trading, rivelando dove il mercato ha trascorso più tempo, dove è stato stabilito il valore e come si è sviluppata l'attività d'asta durante la giornata.
Progettato con una gestione avanzata delle sessioni e consapevolezza del fuso orario, supporta mercati globali inclusi Forex, Futures, Indici, Commodities e Crypto, gestendo automaticamente i cambiamenti dell'ora legale (DST).
Caratteristiche principali
Visualizzazione del profilo TPO
- Mostra caselle TPO orizzontali a ogni livello di prezzo.
Punto di Controllo (POC)
- Identifica automaticamente il prezzo più scambiato/accettato della sessione.
Analisi dell'area di valore
- Calcola il Valore Area Alto (VAH) e il Valore Area Basso (VAL).
Bilancio iniziale (IB)
- Traccia il massimo e il minimo del periodo di apertura.
- Utile per l'analisi di breakout, bilanciamento e giornate di trend.
POC e aree di valore nude
- Estende i livelli POC, VAH e VAL intatti dalle sessioni precedenti.
Rilevamento di stampa singola
- Evidenzia i livelli di prezzo visitati una sola volta durante la sessione.
Livelli di riferimento della sessione
- Apertura, massimo, minimo, chiusura della sessione corrente.
- Apertura, massimo, minimo, chiusura della sessione precedente.
Classificazione automatica del tipo di giornata
L'indicatore classifica automaticamente la struttura della sessione basandosi sui principi del Market Profile
Ideale per
- Trading con Market Profile
- Teoria del mercato d'asta (AMT)
- Trading intraday
- Trading di Futures
- Analisi delle sessioni Forex
- Trading nell'area di valore
- Strategie di inversione POC
- Identificazione di breakout e giornate di trend
*Regola Tick Size, Altezza della riga e Orari della sessione per adattarli al tuo strumento e stile di trading*
Disclaimer: Questo indicatore è fornito solo a scopo educativo e informativo e non costituisce consulenza finanziaria, di investimento o di trading. Market Profile è uno strumento analitico e non garantisce profitti o risultati futuri.
Il trading nei mercati finanziari comporta rischi significativi e le performance passate non garantiscono risultati futuri. Gli utenti sono gli unici responsabili delle proprie decisioni di trading, della gestione del rischio e di eventuali profitti o perdite derivanti.
Esegui sempre la tua analisi e consulta un professionista finanziario qualificato prima di prendere decisioni di investimento o trading.
Riepilogo
Key features include horizontal TPO box visualization, automatic identification of the Point of Control (POC)—the session's most traded price—and calculation of Value Area High (VAH) and Value Area Low (VAL). It tracks the Initial Balance (IB) high and low of the opening period, supports naked POC and value areas from previous sessions, and detects single print price levels visited only once during a session. The indicator also displays current and previous session reference levels (Open, High, Low, Close) and automatically classifies session types based on Market Profile principles.
Designed with advanced session management and timezone awareness, it supports global markets such as Forex, Futures, Indices, Commodities, and Crypto, including automatic daylight saving time adjustments. Users can customize tick size, row height, and session times to fit their instruments and trading styles.
This tool is suited for Market Profile trading, Auction Market Theory, intraday and futures trading, Forex session analysis, value area trading, POC reversion strategies, and breakout or trend day identification.
















![Logo di "High-Low Divergence [Iridio Capital]"](https://cdn.ctrader.com/image/webp/10a9e91b-243a-43f6-bbfe-7376bad5a214_61554)





![Logo di "[Stellar Strategies] Inside Bar with Signals"](https://cdn.ctrader.com/image/webp/1d9e8bfa-3b2c-4440-bb37-5856902008a7_30683)



