
คำอธิบาย
Bar Force คือดัชนีวิเคราะห์ความแข็งแกร่งของแท่งเทียนที่ออกแบบมาเพื่อช่วยให้นักเทรดสามารถระบุช่วงเวลาที่ความผันผวนขยายตัวและโมเมนตัมของตลาดได้อย่างรวดเร็ว
ดัชนีนี้จะจัดประเภทแท่งเทียนแต่ละแท่งโดยอัตโนมัติตามความแข็งแกร่งสัมพัทธ์เมื่อเทียบกับแท่งก่อนหน้า โดยแสดงค่าตัวเลขโดยตรงบนกราฟ ทำให้ง่ายต่อการสังเกตแท่งเทียนที่อ่อน แท่งเทียนปานกลาง หรือแท่งเทียนที่แข็งแกร่งมากในบริบทของตลาดล่าสุด
เวอร์ชัน เต็มรูปแบบ ให้การควบคุมพารามิเตอร์การวิเคราะห์อย่างสมบูรณ์ ช่วยให้นักเทรดสามารถปรับดัชนีให้เหมาะสมกับตลาด ช่วงเวลา และสไตล์การเทรดที่แตกต่างกัน
คุณสมบัติหลัก
✔ การจัดประเภทความแข็งแกร่งของแท่งเทียนโดยอัตโนมัติ
✔ อิงตามความผันผวนของตลาดล่าสุด
✔ แสดงผลบนกราฟโดยตรงเพื่อการวิเคราะห์ด้วยสายตาอย่างรวดเร็ว
✔ เหมาะสำหรับ การเทรดแบบ Price Action, Breakout และ Momentum
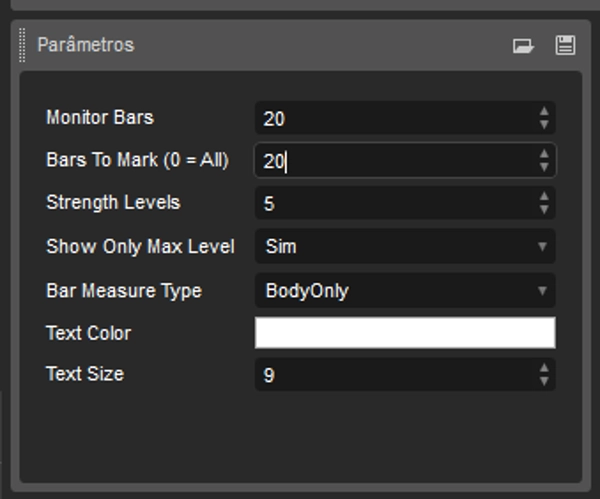
พารามิเตอร์ที่ปรับแต่งได้
เวอร์ชันเต็มมีตัวเลือกการปรับแต่งอย่างครบถ้วน
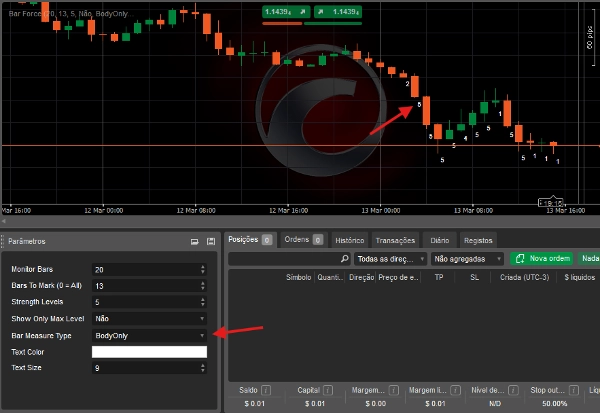
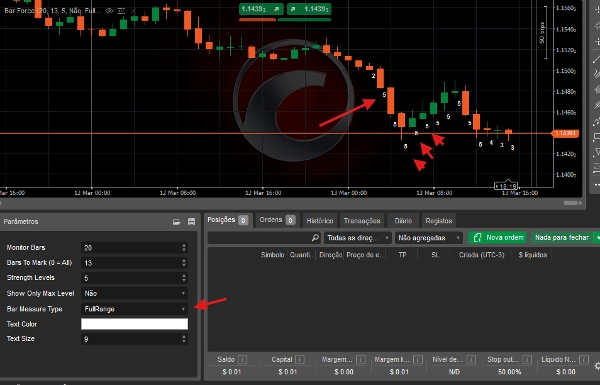
ประเภทการวัดแท่งเทียน
ผู้ใช้สามารถเลือกวิธีการคำนวณความแข็งแกร่งของแต่ละแท่งเทียนได้:
- ช่วงเต็ม – ใช้ช่วงทั้งหมดของแท่งเทียน (สูงสุด – ต่ำสุด)
- เฉพาะตัวแท่งเทียน – ใช้เฉพาะตัวแท่งเทียน (เปิด – ปิด)
สิ่งนี้ช่วยให้ดัชนีสามารถใช้ได้ทั้งสำหรับ การวิเคราะห์ความผันผวน และ การวิเคราะห์ความแข็งแกร่งในทิศทาง.
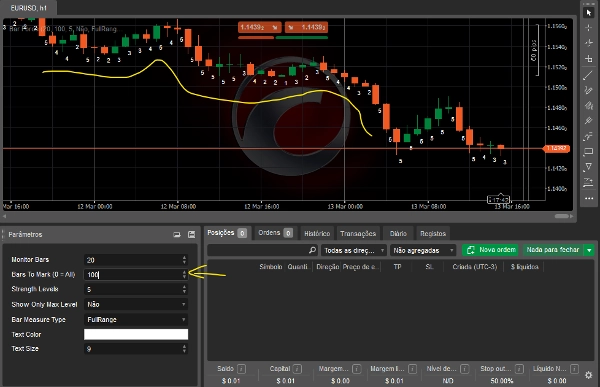
ช่วงการตรวจสอบ
กำหนดจำนวนแท่งเทียนก่อนหน้าที่ใช้ในการคำนวณความแข็งแกร่งเฉลี่ยของตลาด
ตัวอย่าง:
- 50 แท่งเทียน
- 100 แท่งเทียน
- 200 แท่งเทียน
สิ่งนี้ช่วยให้ดัชนีสามารถปรับตัวเข้ากับสภาพตลาดที่แตกต่างกันได้
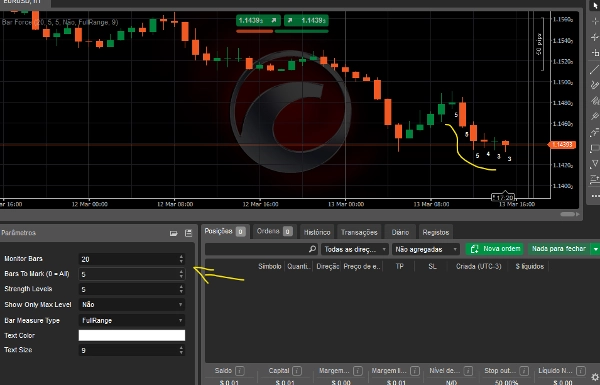
จำนวนแท่งเทียนที่แสดง
นักเทรดสามารถเลือกจำนวนแท่งเทียนล่าสุดที่จะให้แสดงการจัดประเภทความแข็งแกร่งบนกราฟ
ตัวอย่าง:
- 5 แท่งเทียนล่าสุด
- 20 แท่งเทียนล่าสุด
- หรือประวัติทั้งหมด
มาตรวัดความแข็งแกร่ง
กำหนดจำนวนระดับของการจัดประเภทที่ใช้
ตัวอย่าง:
- มาตรวัดจาก 1 ถึง 3
- มาตรวัดจาก 1 ถึง 5
- หรือช่วงที่กำหนดเอง
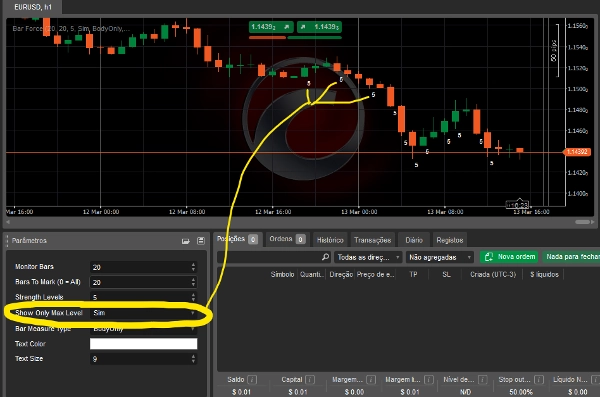
ตัวกรองระดับสูงสุด
ตัวเลือกในการแสดงเฉพาะแท่งเทียนที่ถึงระดับความแข็งแกร่งสูงสุด ช่วยให้ง่ายต่อการระบุ เหตุการณ์โมเมนตัมที่แข็งแกร่ง.
การปรับแต่งภาพ
ผู้ใช้ยังสามารถปรับ:
- สีข้อความ
- ขนาดข้อความ
ช่วยให้ดัชนีเข้ากับรูปแบบกราฟของพวกเขาได้
ดัชนีนี้เหมาะกับใคร?
- นักเทรด Price Action
- นักเทรด Breakout
- นักเทรดที่ต้องการระบุ โมเมนตัมและการขยายตัวของความผันผวน
Bar Force เปลี่ยนการวิเคราะห์แท่งเทียนด้วยสายตาให้กลายเป็น การจัดประเภทความแข็งแกร่งอย่างเป็นวัตถุประสงค์ ช่วยให้นักเทรดสามารถระบุโอกาสที่เป็นไปได้ในตลาดได้อย่างรวดเร็ว
สรุป
รีวิวจากลูกค้า
5 | 67 % | |
4 | 33 % | |
3 | 0 % | |
2 | 0 % | |
1 | 0 % |