
说明
工作原理
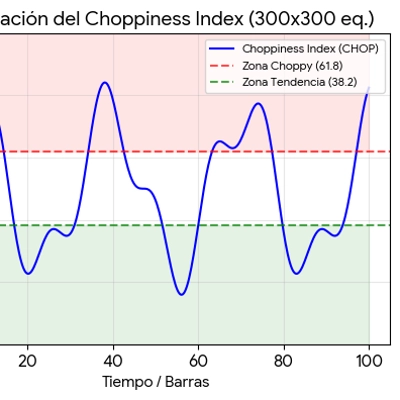
- 周期:默认14。该指标计算该周期内高低范围之和与真实范围之比,然后用对数公式进行缩放:choppiness = 100 * log10(sum(Range) / TrueRange) / log10(Period)
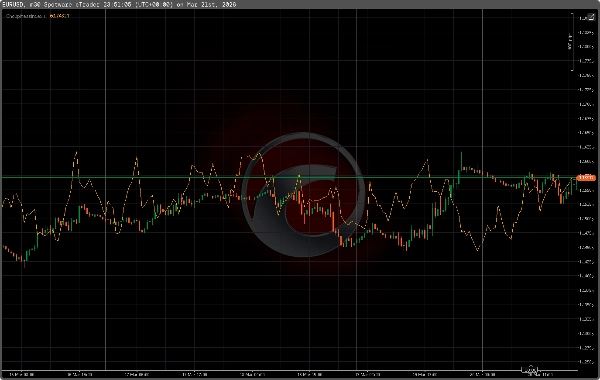
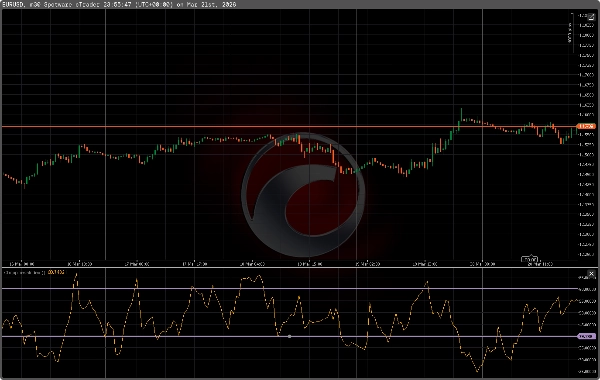
- 输出:一条标记为“CMI”的单线(默认橙色),其中:
-
- 高值 = 市场震荡/区间震荡(避免方向性交易或等待突破确认)
- 低值 = 市场趋势明显(寻找趋势跟随机会)
解释与典型设置
- 默认周期:14(根据时间框架和市场调整为7–28)。
- 常用阈值(建议,可调节):
-
- 高于约61.8 → 高度震荡/区间震荡
- 38.2–61.8 → 混合/盘整
- 低于约38.2 → 趋势市场(强烈方向性运动)
- 时间框架:
-
- 使用较高时间框架(H1,H4,日线)进行趋势确认和波段交易。
- 使用较低时间框架(M5–M30)并减少周期用于剥头皮设置。
- 市场:适用于外汇、黄金/白银(XAUUSD/XAGUSD)、指数和加密货币。性能取决于工具的波动性特征。
策略中的使用方法
- 突破过滤器:仅当CMI低于你的趋势阈值(例如,<38)时才进行突破入场。
- 趋势确认:结合趋势指标(移动平均线、Supertrend)和/或动量指标(MACD、RSI)——当趋势/动量均确认且CMI显示趋势环境时入场交易。
- 避免信号噪音:当CMI高于震荡阈值(例如,>61)时,推迟方向性交易或收紧止损。
- 波动性配对:使用ATR或布林带来确定风险大小并确认波动性状态。
辅助指标
- ADX(趋势强度)、ATR(波动性)、MACD / RSI(动量)、Supertrend或移动平均线(趋势方向)、布林带(区间/波动性)。
安装与参数
- 参数:周期(默认14)。
- 输出名称:CMI(橙色)。
- 非重绘:数值基于已完成的K线计算;请使用常规风险管理和确认手段。
风险提示 本指标提供信息性信号以支持决策,不是独立的交易系统。请对你的工具和时间框架进行回测和验证设置。始终使用适当的风险和资金管理。
摘要
AI summary
The Choppiness Index (CMI) is a technical indicator designed to distinguish trending markets from ranging (choppy) markets, aiding traders in filtering breakout signals and improving trend-following entries. It calculates the ratio of the sum of high–low price ranges over a specified period (default 14) to the true range, then applies a logarithmic scale to produce a single output line labeled "CMI."
Key functionality includes:
- High CMI values indicate a choppy or range-bound market, suggesting caution with directional trades or waiting for breakout confirmation.
- Low CMI values signal trending markets, highlighting opportunities for trend-following strategies.
- Adjustable period settings (7–28) allow tuning based on timeframe and market conditions.
- Suggested thresholds: above ~61.8 for choppy markets, 38.2–61.8 for consolidation, and below ~38.2 for trending conditions.
- Suitable for multiple markets including Forex, commodities (gold, silver), indices, cryptocurrencies, and stocks.
- Recommended use on higher timeframes (H1, H4, Daily) for trend confirmation and swing trading, and on lower timeframes (M5–M30) with shorter periods for scalping.
- Can be combined with other indicators such as ADX, ATR, MACD, RSI, Supertrend, and Bollinger Bands for enhanced strategy development.
- Non-repainting values are calculated on completed bars to support reliable analysis.
This indicator serves as an informational tool to support trading decisions and should be used alongside proper risk management and complementary indicators.
Key functionality includes:
- High CMI values indicate a choppy or range-bound market, suggesting caution with directional trades or waiting for breakout confirmation.
- Low CMI values signal trending markets, highlighting opportunities for trend-following strategies.
- Adjustable period settings (7–28) allow tuning based on timeframe and market conditions.
- Suggested thresholds: above ~61.8 for choppy markets, 38.2–61.8 for consolidation, and below ~38.2 for trending conditions.
- Suitable for multiple markets including Forex, commodities (gold, silver), indices, cryptocurrencies, and stocks.
- Recommended use on higher timeframes (H1, H4, Daily) for trend confirmation and swing trading, and on lower timeframes (M5–M30) with shorter periods for scalping.
- Can be combined with other indicators such as ADX, ATR, MACD, RSI, Supertrend, and Bollinger Bands for enhanced strategy development.
- Non-repainting values are calculated on completed bars to support reliable analysis.
This indicator serves as an informational tool to support trading decisions and should be used alongside proper risk management and complementary indicators.
指标配置
客户评价
0.0
评价:0
客户评价
该产品尚无评价。已经试过了?抢先告诉其他人!
讨论
常见问答
Forex
Signal
Breakout
Scalping
Indices
Commodities
Crypto
Stocks
cTrader Store 提供的所有产品,包括交易机器人、指标和插件,均由第三方开发者提供,仅供信息参考和技术访问之用。cTrader Store 并非经纪商,不提供投资建议、个人推荐或任何未来业绩保证。
该作者的其他作品

猜您喜欢












!["[Hamster-Coder] Moving Average MTF" 标识](https://cdn.ctrader.com/image/webp/b11b98b1-194d-4b8e-b00e-d611826ad159_31226)

价格
注册日期 16/01/2025
3.15M
交易量
2.04K
盈利点数
399
免费安装