Descrizione
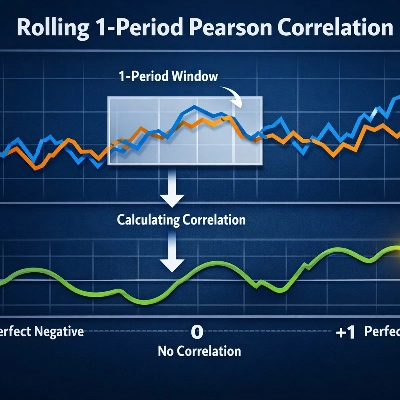
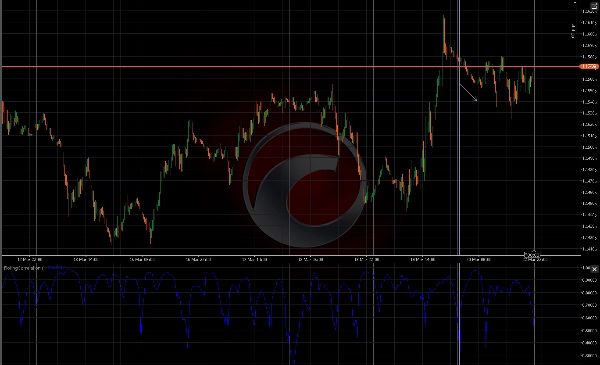
RollingCorrelation calcola la correlazione di Pearson mobile tra ogni prezzo di chiusura e il suo ritardo di 1 barra su una finestra configurabile. L'indicatore restituisce valori nell'intervallo [-1, 1], dove valori vicini a +1 indicano una forte autocorrelazione positiva (continuazione del trend), valori vicini a -1 indicano una forte autocorrelazione negativa (comportamento oscillatorio o di inversione), e valori vicini a 0 indicano poca o nessuna autocorrelazione lineare.
Come funziona Per ogni barra calcola il coefficiente di correlazione di Pearson tra la serie dei prezzi di chiusura e la stessa serie spostata di una barra lungo la finestra del Periodo specificato (default 20). L'implementazione utilizza la formula standard di covarianza / varianza per produrre un singolo valore di correlazione per barra.
Input
- Periodo (int, default 20): numero di barre nella finestra mobile. L'indicatore necessita di almeno Periodo+1 barre per calcolare il primo valore.
Output
- Correlazione (linea): valore di correlazione mobile per ogni barra, intervallo [-1, 1].
Interpretazione e uso pratico
- Vicino a +1: il prezzo mostra una forte persistenza — i movimenti recenti probabilmente continueranno (utile per segnali di trend-following).
- Vicino a -1: forte autocorrelazione negativa — il prezzo spesso si inverte da una barra all'altra (utile per tattiche di mean-reversion).
- Vicino a 0: nessuna relazione lineare coerente al ritardo 1 — il movimento del prezzo appare casuale nella finestra.
- Modelli tipici di segnale: attraversamenti di soglia (es., >0.6 o <−0.6), aumenti/diminuzioni sostenute della correlazione, divergenza tra prezzo e correlazione, o filtraggio degli ingressi da altri sistemi (richiedono correlazione > 0.5 per ingressi di trend, o < −0.5 per setup di inversione).
Idee di trading
- Combina con filtri di volatilità (ATR) per evitare segnali durante rumore a bassa volatilità.
- Usa insieme a indicatori di trend (medie mobili, MACD) per confermare la direzione quando la correlazione è positiva.
- Usa come trigger di mean-reversion a breve termine quando la correlazione è fortemente negativa e il prezzo è a un livello di supporto/resistenza o a una banda di Bollinger estrema.
- Timeframe brevi (es., M1–M15) e periodi più corti possono essere usati per scalping; periodi/timeframe più lunghi per conferma swing.
Impostazioni consigliate
- Il Periodo predefinito = 20 funziona bene come punto di partenza.
- Breve termine: Periodo 8–14 (scalping / intraday).
- Medio termine: Periodo 20–50 (swing / conferma trend).
- Evita di impostare un Periodo troppo grande su simboli molto rumorosi o troppo piccolo su strumenti molto lenti.
Limitazioni e note
- Richiede almeno Periodo+1 barre per calcolare i valori.
- Se la varianza del prezzo all'interno della finestra è zero (prezzi piatti), il denominatore della correlazione può essere zero — questo può produrre risultati NaN/indefiniti. Usa valori di Periodo sensati e assicurati che lo strumento abbia un movimento di prezzo sufficiente.
- Questo indicatore misura solo la correlazione lineare al ritardo 1; non rileva relazioni non lineari o ritardi multi-barra.
- Non è un sistema di trading autonomo — è meglio usato come filtro o strumento di conferma in una strategia.
Esempi suggeriti da includere nella galleria
- EURUSD H1 con Periodo=20 che mostra forte correlazione durante una fase di trend.
- BTCUSD 1H che mostra comportamento oscillatorio e periodi di correlazione negativa.
- XAUUSD 15m che mostra uso per scalping con Periodo breve.
Riepilogo
For each bar, the indicator computes the Pearson correlation coefficient between the series of close prices and the same series shifted by one bar within the specified period. This calculation uses standard covariance and variance formulas to generate a single correlation value per bar.
Traders can use this indicator to identify trend strength or potential reversals, applying threshold crossings or sustained changes in correlation as signals. It is useful for trend-following strategies when correlation is positive and for mean-reversion tactics when correlation is negative. The indicator can be combined with volatility filters and other trend indicators for confirmation. It supports various markets including Forex, stocks, indices, commodities, and cryptocurrencies, and is applicable across multiple timeframes from scalping (M1–M15) to swing trading.
The indicator requires at least Period+1 bars to compute values and is intended as a supplementary tool rather than a standalone trading system.