
คำอธิบาย
How the Supply & Demand Zone Detector works:
1. Impulse Detection (Finding Institutional Activity)
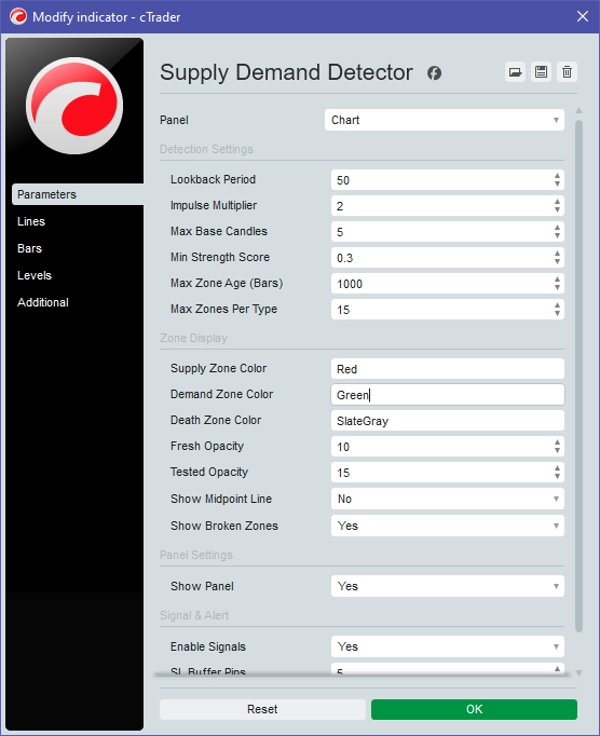
The algorithm continuously calculates the average body size of the last 50 candles (adjustable via Lookback Period). When it detects a candle that is significantly larger than this average (controlled by the Impulse Multiplier, default 1.2x), it flags it as an Impulse Candle.
- Bullish Impulse: Indicates institutional buying. Forms a Demand Zone.
- Bearish Impulse: Indicates institutional selling. Forms a Supply Zone.
2. Base Identification (Drawing the Zone)
Once an impulse is detected, the indicator looks backward to find a cluster of small candles (body size < 50% of the average) immediately preceding the impulse. These are the Base Candles.
- The Top of the zone is the highest high of these base candles.
- The Bottom of the zone is the lowest low of these base candles.
3. Strength Scoring
The indicator calculates a strength score (from 0.00 to 1.00) based on three factors:
- Impulse Size: How massive the breakout candle is.
- Post-Move: How far the price traveled immediately after the breakout.
- Base Density: Fewer base candles mean a faster, more aggressive institutional reaction (higher score).
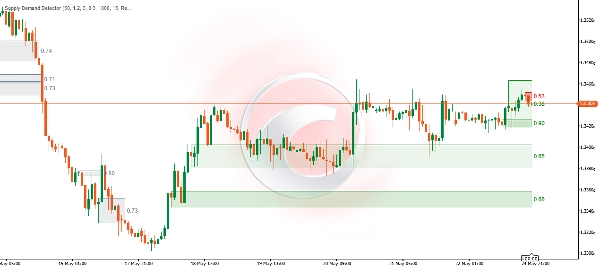
This score is printed inside the far-right edge of the zone box.
4. Zone Lifecycle & The "Death" Mechanic
As live price moves, the indicator updates the status of the zones in real-time:
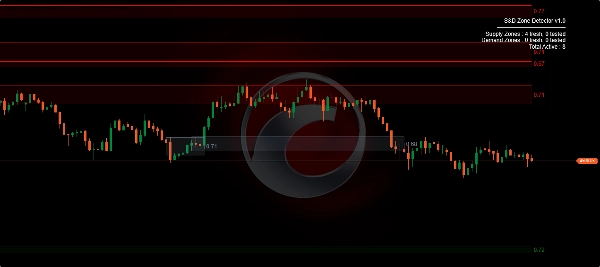
- Fresh (Untouched): The zone is newly formed and highly valid. The box automatically stretches to the right, following the current live candle.
- Tested: Price touches the zone but does not break it. Generates a Signal Arrow (Buy/Sell) on the chart.
- Mitigated: Price penetrates more than 50% deep into the zone. The zone is weakening.
- Broken (Death Zone): If a candle completely closes beyond the zone's opposite boundary (e.g., closes below a Demand Zone), the zone is invalidated.
- The visual reaction: The zone immediately stops stretching to the right (anchored to the
DeathTime), and its color turns into a faded Slate Gray (Death Color) to show it is no longer active.
- The visual reaction: The zone immediately stops stretching to the right (anchored to the
5. Multi-Overlap Filter
To prevent the chart from becoming heavily cluttered, the indicator checks for overlapping zones. If a newly detected zone overlaps more than 70% with an existing older zone of the same type, the new zone is ignored.
สรุป
รีวิวจากลูกค้า
การสนทนา
คำถามที่พบบ่อย
เพิ่มเติมจากผู้เขียนคนนี้

















ราคา
