
คำอธิบาย
Helix Volume Profile สร้างภาพรวมของช่วงเวลาที่สูงกว่าที่กราฟปัจจุบันอยู่ภายใน
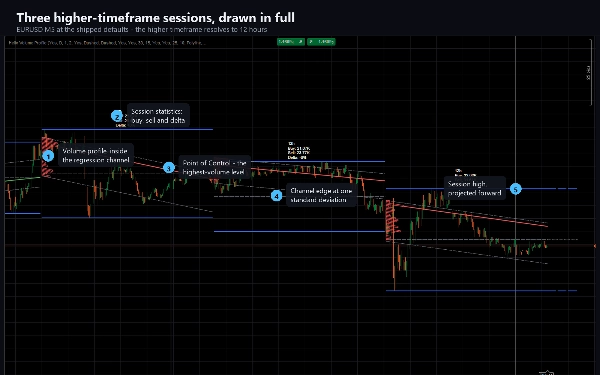
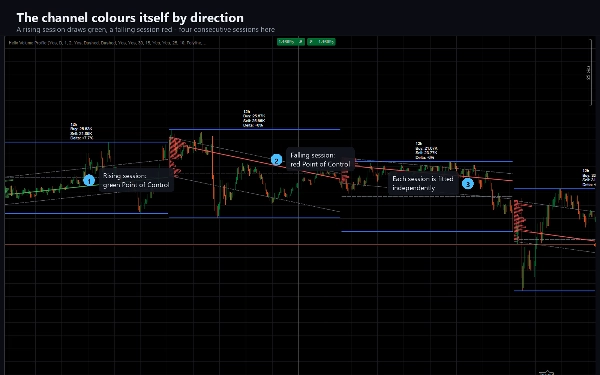
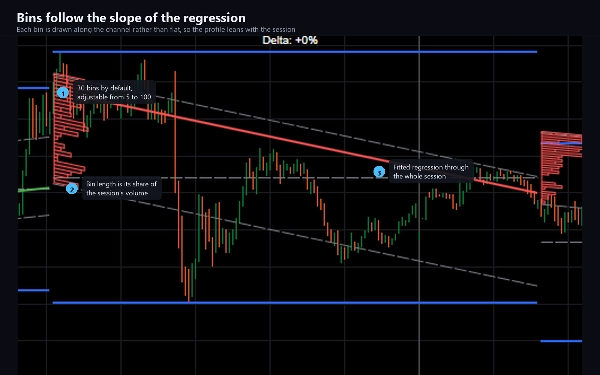
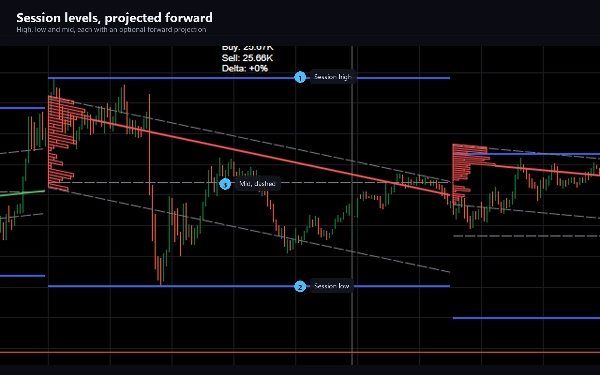
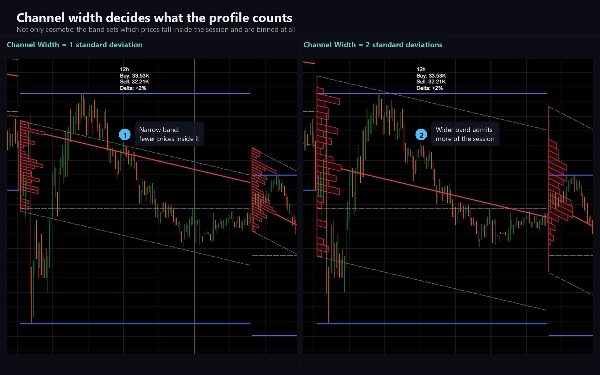
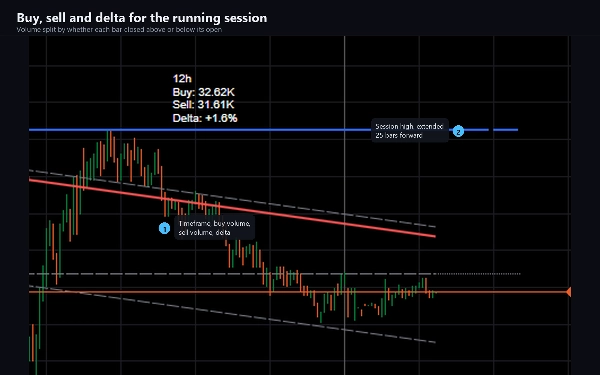
สำหรับแต่ละช่วงเวลาจะทำการฟิตการถดถอยเชิงลอการิทึมผ่านทุกแท่งเทียนจนถึงปัจจุบัน วาดช่องทางที่มีความกว้างเป็นจำนวนส่วนเบี่ยงเบนมาตรฐานที่กำหนดได้รอบๆ และเติมช่องทางนั้นด้วยโปรไฟล์ปริมาณที่ถังข้อมูลตามแนวลาดของการถดถอยแทนที่จะนั่งราบ ถังข้อมูลที่มีปริมาณสูงสุดจะถูกทำเครื่องหมายด้วยเส้น Point of Control ซึ่งมีสีตามทิศทางที่ช่องทางเคลื่อนที่ ระดับสูง ต่ำ และกลางของช่วงเวลาจะถูกวาดข้างๆ และสามารถฉายภาพไปข้างหน้าได้ และป้ายขนาดกะทัดรัดรายงานปริมาณการซื้อ ปริมาณการขาย และความต่างระหว่างพวกมัน
ช่วงเวลาที่สูงกว่าจะถูกเลือกให้โดยอัตโนมัติและปรับให้เข้ากับกราฟ: ช่วงเวลา 12 ชั่วโมงบน M5, สี่ชั่วโมงบน M1, สองวันบน M15, หนึ่งสัปดาห์บน H1, หนึ่งเดือนบน H4 คุณสามารถปิดการตั้งค่านี้และตั้งค่าช่วงเวลาด้วยตัวเอง - นาที วัน สัปดาห์ หรือเดือนทั้งหมดได้รับการยอมรับ
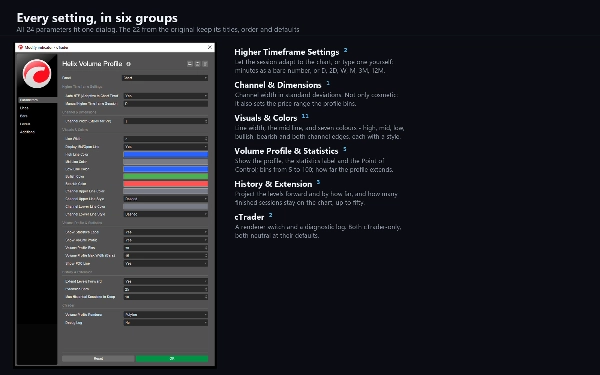
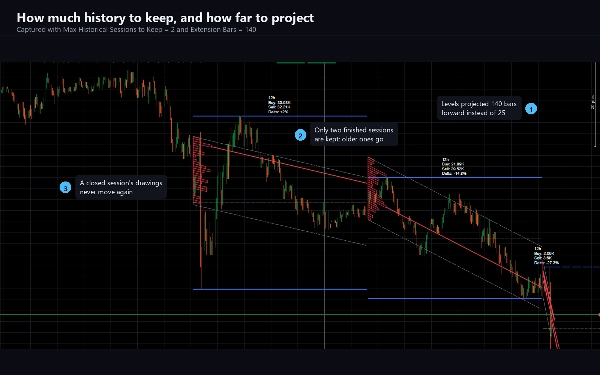
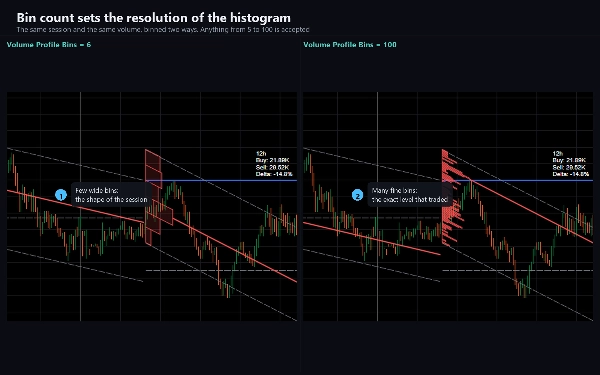
ทุกอย่างสามารถปรับได้ ความกว้างของช่องทาง จำนวนถังโปรไฟล์ตั้งแต่ 5 ถึง 100 ระยะทางที่โปรไฟล์ขยายออกไป ว่าจะแสดง Point of Control ป้ายสถิติ และการฉายภาพไปข้างหน้าหรือไม่ ความกว้างและรูปแบบเส้น สีเจ็ดสี และจำนวนช่วงเวลาที่เสร็จสิ้นที่ยังคงอยู่บนกราฟ สูงสุดห้าสิบช่วงเวลา
วัตถุประสงค์
อ่านตำแหน่งราคาภายในโครงสร้างช่วงเวลาที่สูงกว่าโดยไม่ต้องออกจากช่วงเวลาทำงานของคุณ ช่องทางแสดงการลอยตัวและการกระจายของช่วงเวลา โปรไฟล์แสดงว่าปริมาณสะสมอยู่ที่ใดภายในนั้น Point of Control ทำเครื่องหมายระดับที่มีกิจกรรมมากที่สุด เทรดเดอร์ใช้สิ่งเหล่านี้เพื่อกำหนดแนวรับและแนวต้าน เพื่อประเมินว่าการเคลื่อนไหวยืดออกเกินไปเมื่อเทียบกับช่วงเวลาหรือไม่ และเพื่อดูว่าการซื้อหรือการขายมีอิทธิพลมากกว่า
เหมาะสำหรับเครื่องมือและช่วงเวลาทุกประเภท มีข้อมูลมากที่สุดบนกราฟภายในวันตั้งแต่ M1 ถึง H4 ซึ่งช่วงเวลาที่ปรับได้ให้หน้าต่างที่มีความหมาย บนกราฟรายวันและสูงกว่า ให้ตั้งค่าช่วงเวลาด้วยตนเอง
พฤติกรรม
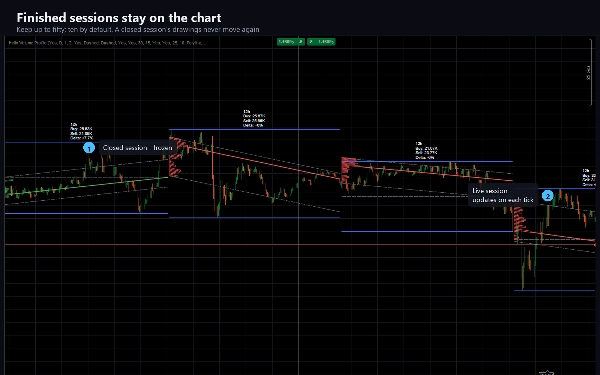
ช่วงเวลาที่ใช้งานจะอัปเดตทุกครั้งที่มีการเคลื่อนไหวและการวาดจะเคลื่อนที่จนกว่าช่วงเวลาจะปิด - ช่องทางจะถูกฟิตใหม่ โปรไฟล์จะถูกสร้างใหม่ และระดับจะถูกวัดใหม่เมื่อแท่งเทียนแต่ละแท่งมาถึง เมื่อช่วงเวลาสิ้นสุด การวาดจะถูกแช่แข็งและจะไม่เปลี่ยนแปลงอีก นี่เป็นเจตนาและเป็นวิธีการทำงานของวิธีนี้ หากคุณต้องการระดับที่ไม่เคลื่อนที่ภายในแท่งเทียน ให้ดูช่วงเวลาที่ปิดแล้วแทนช่วงเวลาที่ใช้งาน
ปริมาณบนสัญลักษณ์ฟอเร็กซ์คือจำนวนทิกที่โบรกเกอร์ของคุณรายงาน ดังนั้นโปรไฟล์จึงสะท้อนฟีดของคุณเอง
เทคนิค
อินดิเคเตอร์, ซ้อนทับ 24 พารามิเตอร์ ไม่มีสิทธิ์การซื้อขาย ไม่มีการเข้าถึงไฟล์และไม่มีการเข้าถึงเครือข่าย - สร้างขึ้นโดยตั้งค่า AccessRights เป็น None และไม่สามารถวางคำสั่งซื้อได้ รวมถึงรุ่นทดลองที่จำกัดเฉพาะ EURUSD โดยไม่มีขีดจำกัดเวลาและไม่มีฟีเจอร์ถูกปิดใช้งาน
เอกสารครอบคลุมการติดตั้ง ทุกพารามิเตอร์พร้อมวัตถุประสงค์ และคู่มือแก้ไขปัญหาที่อธิบายพฤติกรรมแต่ละอย่างที่ทำให้ผู้คนประหลาดใจ
การซื้อขายมีความเสี่ยง ผลการดำเนินงานในอดีตไม่รับประกันผลลัพธ์ในอนาคต
สรุป
The higher timeframe session adapts automatically based on the chart timeframe (e.g., 12 hours on M5, one week on H1) but can be manually set to minutes, days, weeks, or months. Users can customize channel width, number of volume bins (5 to 100), profile extension, visibility of elements, colors, line styles, and how many past sessions remain visible (up to 50).
The live session updates on every tick, recalculating the channel and volume profile until session close, after which the data is fixed. Volume data reflects the broker's tick count for forex symbols. Helix Volume Profile is suitable for any instrument and timeframe, with particular utility on intraday charts from M1 to H4. It includes 24 adjustable parameters and operates without trading permissions or network access.
การสนทนา
รีวิวจากลูกค้า
5 | 0 % | |
4 | 100 % | |
3 | 0 % | |
2 | 0 % | |
1 | 0 % |













!["[Stellar Strategies] VBO" โลโก้](https://cdn.ctrader.com/image/webp/f034c012-94d4-445a-a01b-febd1cdedaef_36944)