
swingh6
อินดิเคเตอร์
140 ดาวน์โหลด
เวอร์ชัน 1.0, Mar 2025
Windows, Mac
คำอธิบาย
คำอธิบายกลยุทธ์ติดตามแนวโน้ม Forex (ภาษาอังกฤษ)
กลยุทธ์ ติดตามแนวโน้ม นี้ถูกออกแบบมาเพื่อระบุ แนวโน้มตลาดที่แข็งแกร่ง โดยใช้ ค่าเฉลี่ยเคลื่อนที่แบบทวีคูณ (EMAs), MACD และ ADX ซึ่งสร้าง สัญญาณซื้อและขาย ตามแรงขับเคลื่อนและความแข็งแกร่งของแนวโน้ม
วิธีการทำงาน
1️⃣ การระบุทิศทางแนวโน้ม
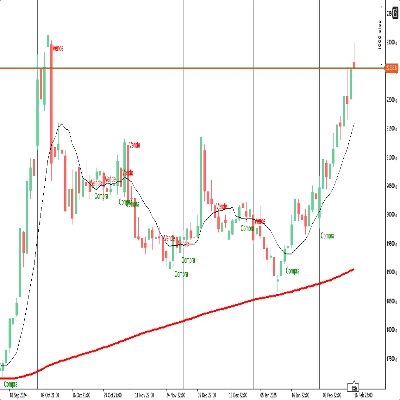
- EMA เร็ว (21) และ EMA ช้า (50) กำหนดทิศทางแนวโน้มโดยรวม:
-
- แนวโน้มขาขึ้น → EMA เร็วอยู่เหนือ EMA ช้า
- แนวโน้มขาลง → EMA เร็วอยู่ต่ำกว่า EMA ช้า
2️⃣ การวัดแรงขับเคลื่อนของแนวโน้ม (ฮิสโตแกรม MACD)
- ฮิสโตแกรม MACD ยืนยันแรงขับเคลื่อน:
-
- แรงขับเคลื่อนขาขึ้น → ฮิสโตแกรม MACD อยู่เหนือศูนย์
- แรงขับเคลื่อนขาลง → ฮิสโตแกรม MACD อยู่ต่ำกว่าศูนย์
3️⃣ การตรวจสอบความแข็งแกร่งของแนวโน้ม (ตัวชี้วัด ADX)
- ADX (14) วัดความแข็งแกร่งของแนวโน้ม:
-
- แนวโน้มแข็งแกร่ง → ADX อยู่เหนือ 25
- แนวโน้มอ่อนแอ → ADX อยู่ต่ำกว่า 25 (ไม่มีสัญญาณ)
การดำเนินการซื้อขาย
✅ สัญญาณซื้อ (เข้าซื้อแบบขาขึ้น)
- EMA เร็ว > EMA ช้า (แนวโน้มขาขึ้น)
- ฮิสโตแกรม MACD > 0 (ยืนยันแรงขับเคลื่อน)
- ADX > 25 (แนวโน้มแข็งแกร่ง)
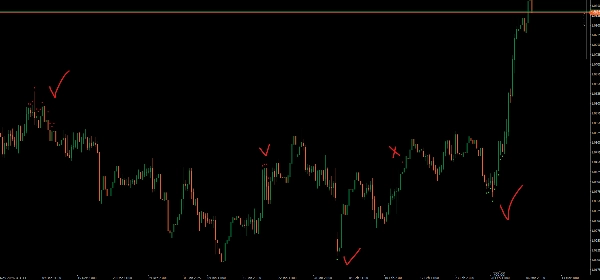
- 🔹 ลูกศรซื้อ ปรากฏ ใต้ราคาต่ำสุด
❌ สัญญาณขาย (เข้าขายแบบขาลง)
- EMA เร็ว < EMA ช้า (แนวโน้มขาลง)
- ฮิสโตแกรม MACD < 0 (ยืนยันแรงขับเคลื่อน)
- ADX > 25 (แนวโน้มแข็งแกร่ง)
- 🔻 ลูกศรขาย ปรากฏ เหนือราคาสูงสุด
คุณสมบัติหลัก
✔ หลีกเลี่ยงแนวโน้มอ่อนแอ โดยใช้ ADX
✔ กรองสัญญาณเท็จ ด้วยการยืนยันจาก MACD
✔ ปรับพารามิเตอร์ได้ เพื่อการปรับแต่งที่ดียิ่งขึ้น
ตัวชี้วัดนี้ช่วยให้เทรดเดอร์ ขี่แนวโน้มที่แข็งแกร่ง ในขณะที่หลีกเลี่ยงสภาวะตลาดที่อ่อนแอ 🚀
สรุป
โปรไฟล์อินดิเคเตอร์
รีวิวจากลูกค้า
0.0
รีวิว: 0
รีวิวจากลูกค้า
ยังไม่มีรีวิวสำหรับผลิตภัณฑ์นี้ หากเคยลองแล้ว ขอเชิญมาเป็นคนแรกที่บอกคนอื่น!
การสนทนา
คำถามที่พบบ่อย
Forex
Signal
MACD
ผลิตภัณฑ์ที่มีให้บริการผ่าน cTrader Store รวมถึงบอทการเทรด อินดิเคเตอร์ และปลั๊กอิน มีให้บริการโดยนักพัฒนาบุคคลที่สามและมีไว้เพื่อวัตถุประสงค์ในการเข้าถึงข้อมูลและทางเทคนิคเท่านั้น cTrader Store ไม่ใช่โบรกเกอร์และไม่ได้ให้คำแนะนำการลงทุน คำแนะนำส่วนบุคคล หรือการรับประกันผลการดำเนินงานในอนาคต


ราคา
ตั้งแต่ 21/02/2025
466.3M
ปริมาณการเทรด
180.83K
Pips ที่ได้กำไร
22
การขาย
6.87K
ติดตั้งฟรี