
Descrição
Probabilidade de Rompimento é um indicador valioso que calcula a probabilidade de uma nova máxima ou mínima e a exibe como um nível com sua porcentagem. A probabilidade de uma nova máxima e mínima é testada retroativamente, e os resultados são mostrados em uma tabela — uma maneira simples de entender a probabilidade da próxima vela atingir uma nova máxima ou mínima. Além disso, o indicador exibe quatro níveis adicionais acima e abaixo da vela com a probabilidade de atingir esses níveis.
O indicador ajuda os traders a entender a probabilidade da direção da próxima vela, que pode ser usada para definir seu viés de negociação.
█ Cálculos
O algoritmo calcula todas as velas verdes e vermelhas separadamente, dependendo se a vela anterior foi vermelha ou verde, e atribui pontuações se uma ou mais linhas foram alcançadas. O algoritmo então calcula quantas velas atingiram esses níveis na história e exibe isso como um valor percentual em cada linha.
█ Exemplo
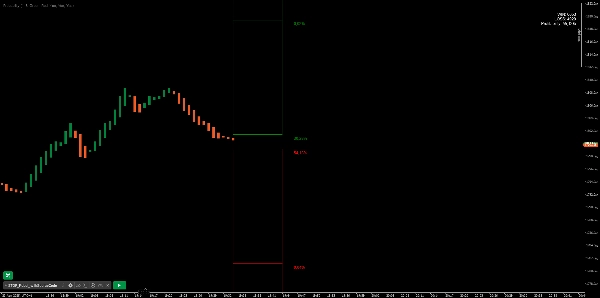
Neste exemplo, a vela anterior foi verde; podemos ver que uma nova máxima foi atingida 72,82% das vezes e a mínima apenas 28,29%. Neste caso, uma nova máxima foi feita.
Resumo
Avaliações de clientes
5 | 100 % | |
4 | 0 % | |
3 | 0 % | |
2 | 0 % | |
1 | 0 % |


