Açıklama
Kâra Geçme Süresi Göstergesi LITE
Lite Sürüm
Bu, Kâra Geçme Süresi Göstergesinin ücretsiz deneme sürümüdür. EURGBP ile sınırlıdır ve sadece 2 dakika çalışacaktır.
Kâra Geçme Süresi Göstergesi
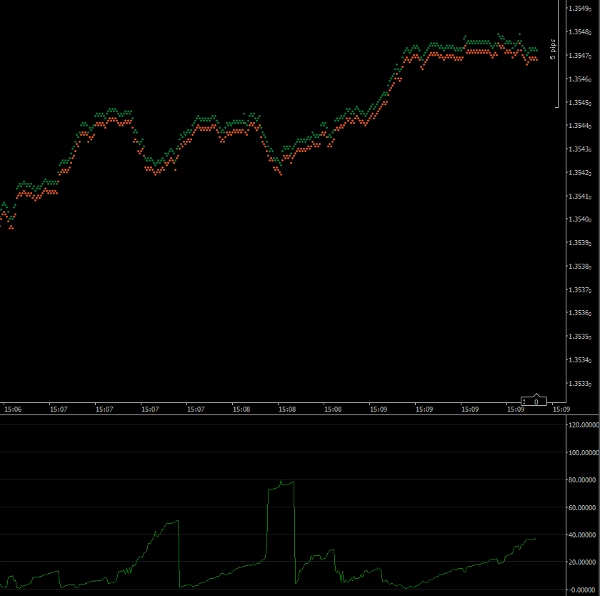
Bu gösterge, işleminizin piyasaya giriş zamanını belirlemenize yardımcı olur. Grafik, işleminizin kâra geçmesi için gereken tahmini saniye sayısını gösterir. Piyasa hızlı ve sizin yönünüzde hareket ediyorsa, gösterge küçük bir sayı verir. Piyasa size karşı veya yavaş hareket ediyorsa, sayı daha büyük olur.
Gösterge, işleminizin kâra geçmesi için gereken pip sayısını hesaplar. Ardından bunu fiyatın hareket ettiği mevcut hızla karşılaştırır.
Not: Bu gösterge 1 Tick Zaman Çerçevesinde çalıştırılmalıdır.
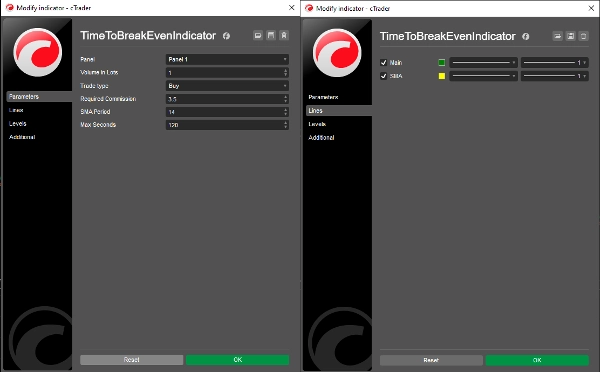
Parametreler
Lot Cinsinden Hacim: Önerilen işleminizin hacmi
İşlem Türü: İşleminizin alım mı yoksa satım mı olduğu
Gerekli Komisyon: İşleminizin alacağı komisyon (bunu Hızlı İşlem penceresinden alabilirsiniz)
SMA Periyodu: Basit Hareketli Ortalama grafiğinin periyodu (varsayılan = 14)
Maksimum Saniye: Kaydedilecek maksimum saniye sayısı (aşağıya bakınız)
Çizgiler
Ana: Gösterge grafik çizgisi (varsayılan = yeşil)
SMA: Basit Hareketli Ortalama grafik çizgisi (varsayılan = sarı)
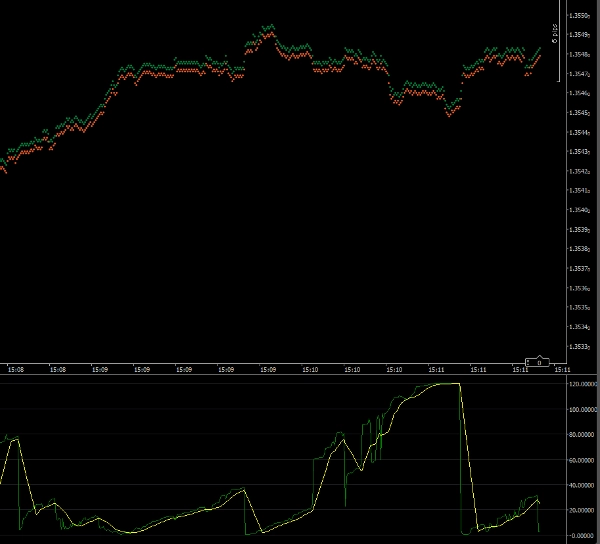
Maksimum Saniye
Göstergeye çok büyük değerler göstermesine izin vermek, kâra geçme süresi küçük olduğunda göstergenin ölçeğinin ayrıntıları görmenizi engelleyeceği anlamına gelir. Bu parametreyi ayarlamak, göstergenin maksimum ölçeğini belirlemenizi sağlar. Varsayılan olarak 120 (2 dakika) olarak ayarlanmıştır. Böylece 2 dakika veya daha fazla olan herhangi bir çıktı 120 saniye olarak çizilir.
Dr Andy Larkin
Telif Hakkı 2025, Tüm Hakları Saklıdır
26 Mayıs 2025
Yasal
Bu göstergenin sonuçları, canlı işlemde kullanmadan önce doğruluk açısından kontrol edilmelidir.
Bu göstergenin sonuçları için herhangi bir garanti verilmez veya ima edilmez.
Bu göstergenin kullanımı sonucu oluşabilecek kayıplar için herhangi bir sorumluluk kabul edilmez.