
Descripción
- Qué hace (su valor).
- Cómo ayuda a los traders.
- Qué lo hace único.
- Cómo usarlo (breve).
- Lo que desbloqueará la versión de pago (avance).
🔸
Indicador de Horas Doradas de Sesión
(Versión Gratuita)
Descripción
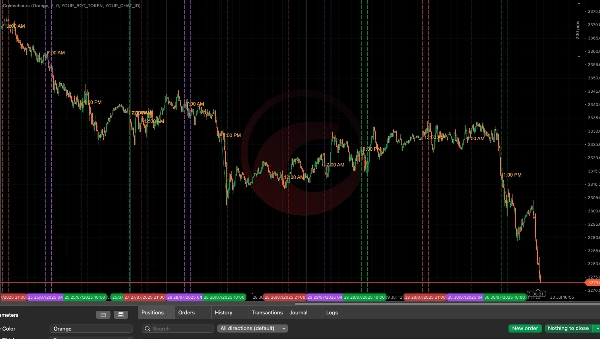
El indicador Horas Doradas de Sesión está diseñado para traders serios que buscan visualizar ventanas de trading de alta probabilidad basadas en patrones de liquidez por sesión. Esta herramienta resalta automáticamente los períodos clave de tiempo en las sesiones de Asia, Londres y Nueva York — a menudo denominadas las “horas doradas” del mercado — cuando es más probable que el precio rompa el rango y revele la intención institucional.
Qué hace:
- Rastrea los máximos/mínimos de la sesión de Asia (00:00–08:00 UTC) para mapear zonas de liquidez.
- Resalta las horas clave de Londres y Nueva York como:
-
- Pre-Cierre de Londres (06:00–07:00 UTC)
- Hora de Cierre de Londres (07:00–08:00 UTC)
- Zona de Barrido de la Tarde en NY (13:00–14:00 UTC)
- Dibuja guías visuales en tu gráfico para anclar tu atención en las horas diarias de ruptura.
Cómo te ayuda:
- Detecta fácilmente zonas de barrido de liquidez durante los solapamientos de sesiones.
- Enfoca tus decisiones de trading alrededor de marcos temporales de dinero inteligente — no más trading en zonas muertas.
- Reconoce visualmente dónde tienden a ocurrir falsas rupturas y reversos.
- Funciona en cualquier instrumento y cualquier marco temporal que siga ciclos globales de sesión.
Características clave:
- Color, grosor y extensiones de tiempo de línea ajustables.
- Seguimiento automático de sesiones sin necesidad de trazado manual.
- Soporte incorporado para los últimos 15 días de trading.
- Visuales limpios y no intrusivos en el gráfico.
Ideal para:
- Traders estilo ICT (modelos de liquidez + temporización)
- Scalpers de acción del precio
- Traders que usan confluencias basadas en tiempo
🔓 ¿Quieres más?
La Versión Pro (Próximamente) añade:
- Alertas de ruptura en tiempo real enviadas directamente a Telegram
- Lógica para falsas rupturas en Asia → reversos en Londres y máximos/mínimos de Londres → reversos en NY
- Temporizador inteligente para evitar alertas excesivas
- Seguimiento completo de máximos/mínimos basados en sesión con etiquetado de señales
- Hoja de ruta futura: alertas FVG, zonas internas de liquidez y filtrado de señales
Resumen
Valoraciones de clientes
5 | 0 % | |
4 | 100 % | |
3 | 0 % | |
2 | 0 % | |
1 | 0 % |


