Beschreibung
📈 Stochastischer RSI
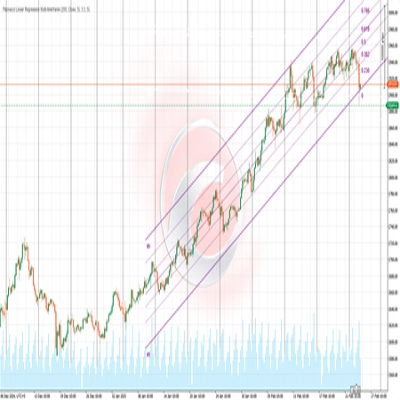
Der Stochastische RSI Indikator ist ein Momentum-Oszillator, der die Stochastische Formel auf RSI-Werte anwendet statt auf den Preis, wodurch er ein Indikator zweiter Ableitung ist. Er ist besonders nützlich, um überkaufte und überverkaufte Zustände mit höherer Empfindlichkeit als der Standard-RSI zu erkennen.
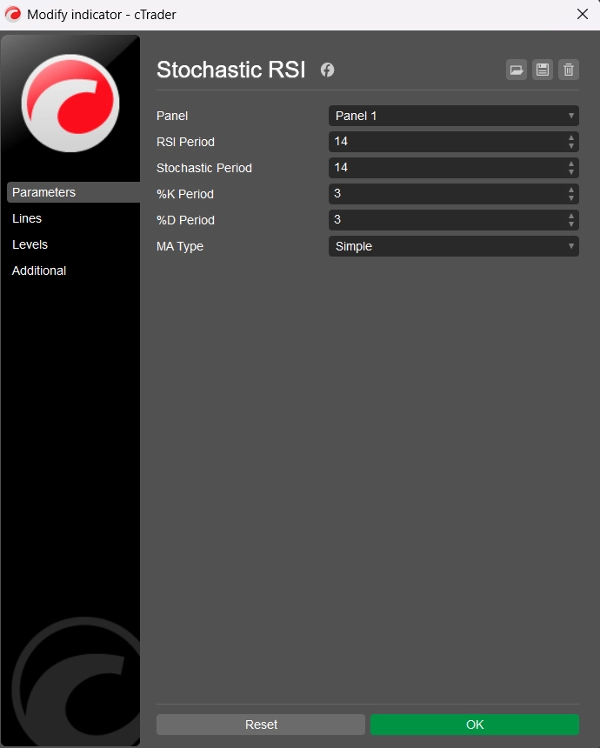
🛠️ Parameter
RSI-Periode: Der Rückblickzeitraum zur Berechnung des Basis-RSI (Standard = 14)
Stochastische Periode: Der Rückblickzeitraum, der auf RSI-Werte angewendet wird, um den Stochastischen RSI zu berechnen (Standard = 14)
%K-Periode: Der Glättungszeitraum für die %K-Linie (Standard = 3)
%D-Periode: Der Glättungszeitraum für die %D-Linie (Standard = 3)
MA-Typ: Typ des gleitenden Durchschnitts zur Glättung: Einfach oder Exponentiell (Standard = Einfach)
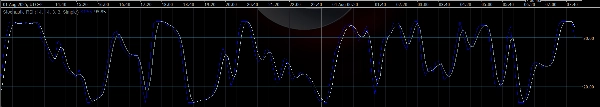
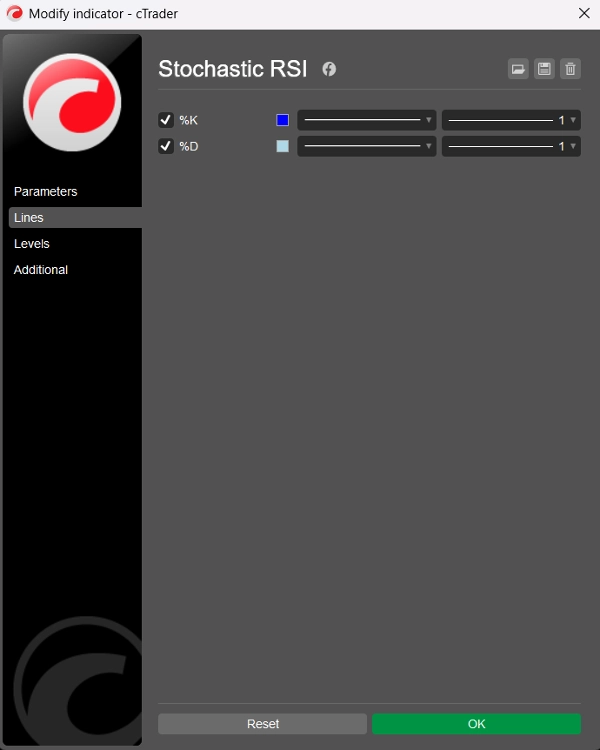
📊 Ausgabelinien
- %K-Linie: Geglätteter Stochastischer RSI (blau)
- %D-Linie: Geglätteter gleitender Durchschnitt von %K (hellblau)
Beide Linien oszillieren zwischen 0 und 100, was klare Überkauft- und Überverkauft-Anzeigen ermöglicht.
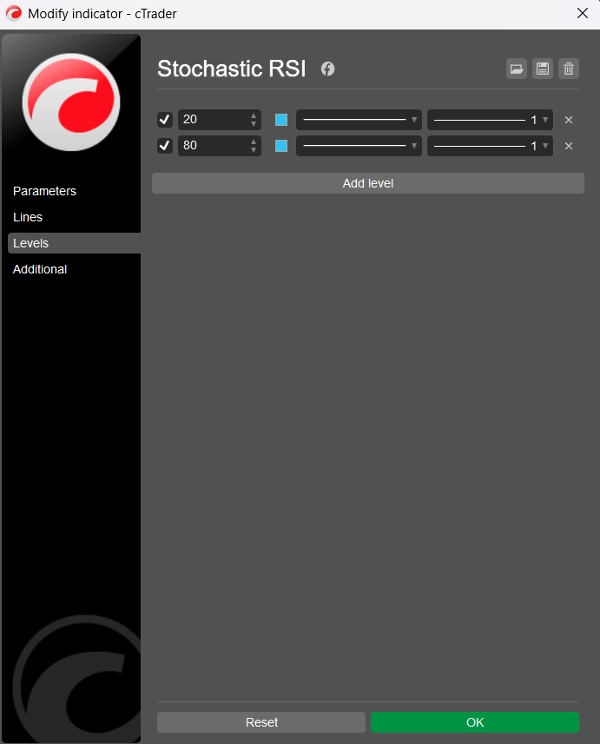
⚠️ Vorgeschlagene Niveaus
Obwohl der Indikator standardmäßig keine statischen Niveaus anzeigt, wird den Nutzern empfohlen, diese manuell über den „Levels“-Tab in cTrader hinzuzufügen:
- Level 80 → Überkauft
- Level 20 → Überverkauft
Diese Niveaus funktionieren ähnlich wie beim traditionellen Stochastischen Oszillator, werden jedoch auf das RSI-Verhalten angewendet, wodurch die Signale schärfer und oft schneller sind.
🧠 Anwendung
- Überkauft (>80): Kann anzeigen, dass der Preis nach oben überdehnt ist — Potenzial für eine Umkehr oder Konsolidierung.
- Überverkauft (<20): Kann signalisieren, dass der Preis überverkauft ist — mögliche Erholung oder Trendwende.
- %K- und %D-Kreuzungen: Können ähnlich wie Stochastik oder MACD verwendet werden — ein bullisches Kreuz unter 20 oder ein bärisches Kreuz über 80 kann handelbar sein.
🏷️ Hinweise
- Entwickelt für cTrader mit C# und der Automate API
- Sauber, effizient und anpassbar mit zwei MA-Typen
- Code und Logik von BlueRocketBots & ChatGPT (OpenAI)
- Sauberer Code (insgesamt 109 Zeilen; 60 Zeilen Code, 29 Zeilen Text, 20 Zeilen Leerzeilen)
- Kostenlos!