
Açıklama
SES UYARILI TEKNİK ANALİZ
TEKNİK ANALİZ göstergesi, sağlam trendleri, piyasa momentumu ve hacim onayını belirlemeye odaklanan birden çok teknik göstergenin entegre edildiği, cAlgo platformu için geliştirilmiş gelişmiş bir teknik analiz çözümüdür. ADX (Ortalama Yön Endeksi) ile eğim analizi, hacim filtreleme ve gerçek zamanlı çoklu gösterge teknik analizini birleştirerek, yatırımcılara karar verme için kapsamlı ve güvenilir bir görünüm sunar.
🔍 Ana Strateji
1. Temel: ADX + DI (Yönsel Hareket Sistemi)
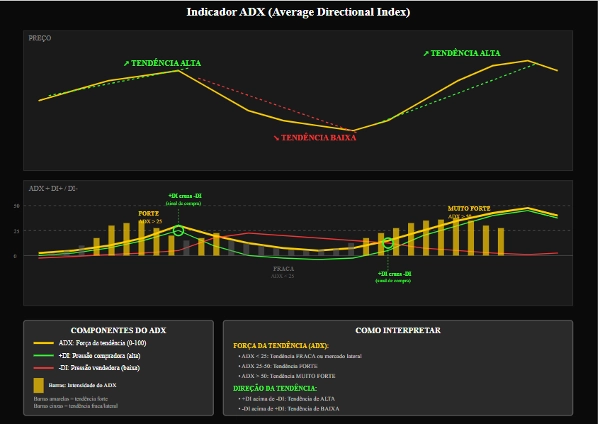
Göstergenin çekirdeği, trendin gücünü ölçen ADX (Ortalama Yön Endeksi)'dir.
+DI (Pozitif Yön Göstergesi) ve -DI (Negatif Yön Göstergesi) bileşenleri trendin yönünü belirler:
+DI > -DI → Yükselen trend
-DI > +DI → Düşen trend
2. Eğim ile Dinamik Momentum Analizi
ADX, +DI ve -DI'nin eğimi doğrusal regresyon kullanılarak hesaplanır.
Bu, trendin:
Güç kazandığını (pozitif eğim)
Güç kaybettiğini (negatif eğim)
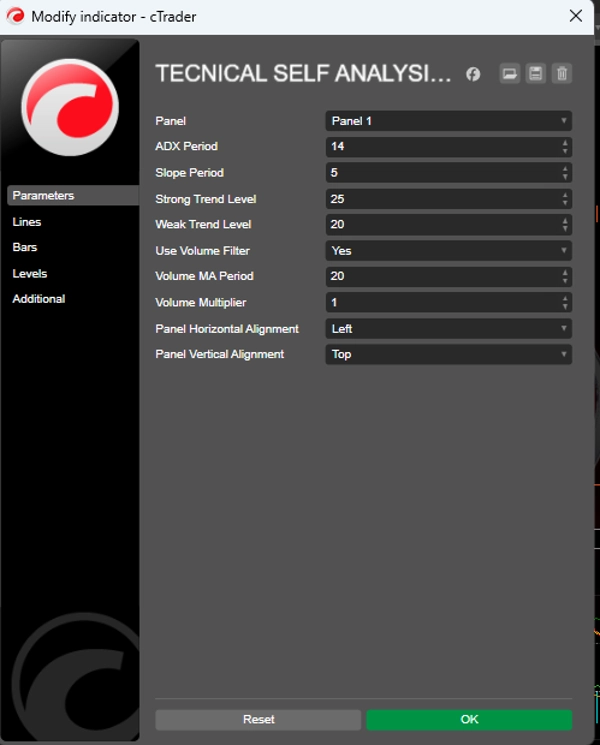
3. Referans Seviyeleri
Güçlü Trend Seviyesi: Trendin güçlü kabul edildiği seviye (varsayılan: 25)
Zayıf Trend Seviyesi: Geçerli bir trend olarak kabul edilen minimum seviye (varsayılan: 20)
Zayıf seviyenin altındaki trendler yatay veya net yönü olmayan olarak değerlendirilir.
📈 Sinyal Üretimi
Alış Koşulları
✅ +DI'nin -DI'nin üzerine çıkması
✅ ADX'in zayıf trend seviyesinin üzerinde olması (Zayıf Trend Seviyesi)
✅ Pozitif ADX ve +DI eğimleri
✅ Hacim onayı (isteğe bağlı)
Satış Koşulları
✅ -DI'nin +DI'nin üzerine çıkması
✅ ADX'in zayıf trend seviyesinin üzerinde olması (Zayıf Trend Seviyesi)
✅ Pozitif ADX ve -DI eğimleri
✅ Hacim onayı (isteğe bağlı)
Güçlü Sinyaller: ADX Güçlü Trend Seviyesinin üzerinde olduğunda ve eğimler önemli ölçüde pozitif olduğunda, gösterge ardışık tekrar eden girişlerden kaçınarak güçlendirilmiş sinyaller üretir. 📊 Hacim Filtresi (İsteğe Bağlı)
Gösterge, sinyal üretmeden önce hacim onayı isteyebilir.
Mevcut hacim, hacmin hareketli ortalaması × çarpanına eşit veya daha büyük olmalıdır.
Bu, likiditesi düşük piyasalarda yanlış kırılmaları ve sinyalleri filtrelemeye yardımcı olur.
🧠 Gelişmiş Teknik Analiz (Etkileşimli Panel)
TEKNİK ANALİZ, grafikte iki etkileşimli panel içerir:
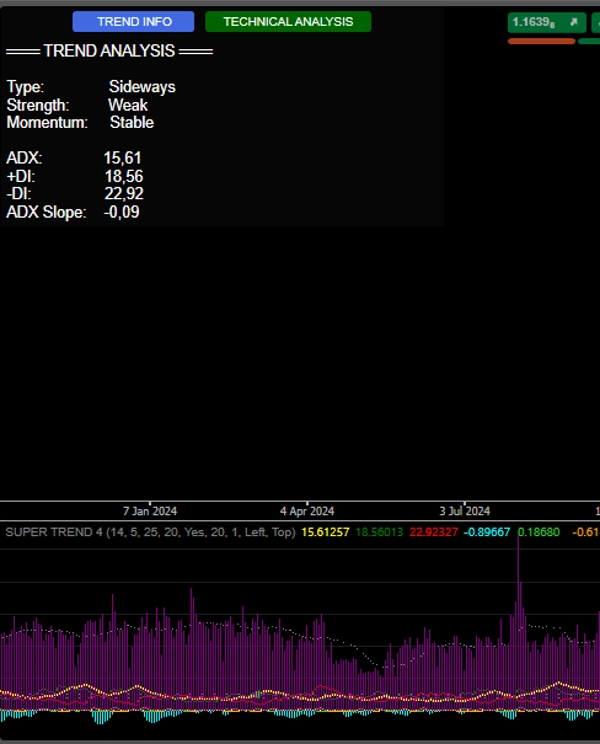
1. TREND BİLGİSİ
Trend Türü: Yükselen / Düşen / Yatay
Trend Gücü: Güçlü / Zayıf
Momentum: Güçleniyor / Zayıflıyor / Stabil
Mevcut ADX, +DI, -DI ve Eğim değerleri
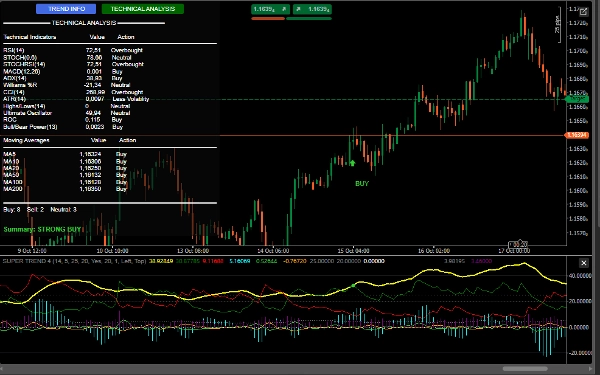
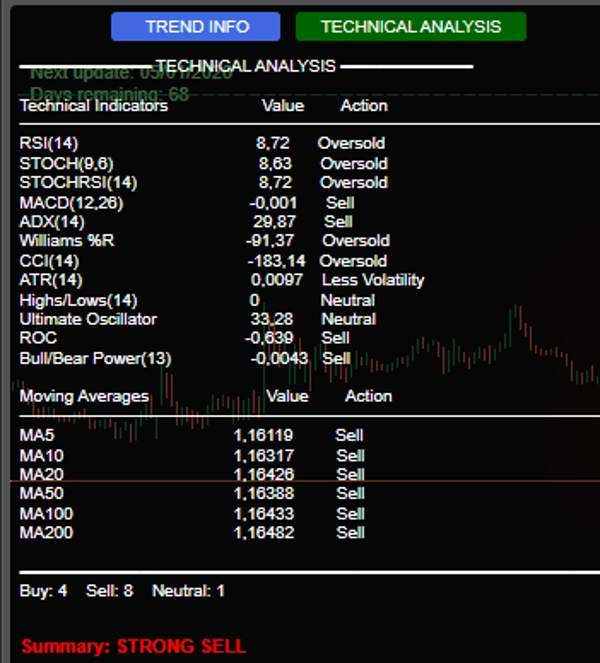
2. TEKNİK ANALİZ
Gerçek zamanlı çoklu gösterge analizi yapar, şunları içerir:
RSI(14) – Aşırı Alım/Aşırı Satım
Stokastik(14) – Momentum
MACD(12,26) – Kesişimler ve uyumsuzluklar
Williams %R – Piyasa uçları
CCI(14) – Tipik fiyat sapmaları
ROC(12) – Değişim hızı
Ultimate Osilatör – Güç onayı
Boğa/Ayı Gücü – Alış/Satış baskısı
Hareketli Ortalamalar (5,10,20,50,100,200) – Uzun vadeli trend
Son Özet: Sistem alış/satış/nötr sinyalleri sayar ve net bir öneri verir:
GÜÇLÜ AL (≥7 alış sinyali)
ALIŞ
SATIŞ
GÜÇLÜ SAT (≥7 satış sinyali)
NÖTR
🔔 Uyarılar ve Görselleştirme
Grafikte görsel sinyaller:
"ALIŞ"/"SATIŞ" etiketli yeşil/kırmızı oklar
Sesli bildirimler (Windows)
Konsolda detaylı kayıtlar ile:
Sinyal zamanı
ADX, DI ve hacim değerleri (etkinleştirilmişse)
🛡️ Rekabet Avantajları
✅ Birden çok göstergenin tek bir panoda entegrasyonu
✅ Trend gücü ve yönüne odaklanma (sadece fiyat değil)
✅ Daha yüksek güvenilirlik için hacim filtresi
✅ Etkileşimli ve bilgilendirici arayüz
✅ Görsel ve sesli uyarılarla net sinyaller


!["[Stellar Strategies] MARSI Signal Plotter" logosu](https://cdn.ctrader.com/image/webp/7b2b8da6-8f8e-4646-8d4a-4710c516c01e_25567)


