
Dynamic Trend Flux
Gösterge
Sürüm 1.0, Nov 2025
Windows, Mac
4.0
Değerlendirmeler: 1
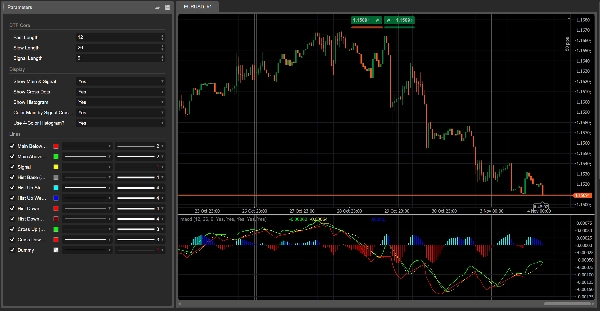
Dinamik Trend Akışı
Tür: Momentum / trend osilatörü (MACD tarzı, çok renkli)
Ne yapar
Dinamik Trend Akışı, klasik hızlı/yavaş EMA farkı artı bir sinyal çizgisine dayanan renkli bir momentum osilatörüdür.
Size şunları hızlıca görmenize yardımcı olur:
- momentumun boğa mı ayı mı olduğunu,
- momentumun güçlenip güçlenmediğini veya zayıflayıp zayıflamadığını,
- ve trend değişimlerinin nerede gerçekleştiğini (ana çizgi ile sinyal çizgisinin kesişimleri).
Gösterge şunları çizer:
- Ana çizgi (Akış çizgisi)
-
- hızlı ve yavaş EMA arasındaki farktan oluşturulur
- sinyal çizgisinin üzerinde veya altında olup olmamasına bağlı olarak renk değiştirir (isteğe bağlı).
- Sinyal çizgisi
-
- ana çizginin hareketli ortalaması olup, daha yumuşak bir tetikleyici olarak kullanılır.
- 4 renkli histogram (isteğe bağlı)
-
- ana çizgi ile sinyal arasındaki mesafeyi gösterir,
- renk hem yönü (sıfırın üstü/altı) hem de güç değişimini bar bazında kodlar.
- Kesişimlerde noktalar (isteğe bağlı)
-
- ana çizginin sinyal çizgisini kestiği yerleri vurgular → potansiyel trend faz değişimleri.
Tüm hesaplamalar mevcut grafik zaman diliminde yapılır.
Nasıl okunur
1. Sıfır çizgisi
- Değerler sıfırın üzerinde → boğa baskısı hakimdir.
- Değerler sıfırın altında → ayı baskısı hakimdir.
2. Renkli histogram
4 renk modu AÇIK olduğunda:
- Aqua → sıfırın üzerinde ve yükseliyor
-
- güçlü / artan boğa momentumu.
- Mavi → sıfırın üzerinde ama düşüyor
-
- boğa trendi devam ediyor, ancak momentum soğuyor.
- Kırmızı → sıfırın altında ve düşüyor
-
- güçlü / artan ayı momentumu.
- Bordo → sıfırın altında ama yükseliyor
-
- ayı fazı devam ediyor, ancak momentum güç kaybediyor.
Bu, uyumsuzlukları ve momentum değişimlerini görsel olarak çok daha kolay fark etmenizi sağlar.
3. Ana ve Sinyal çizgileri
- Ana çizgi Sinyalin üzerinde → boğa fazı.
- Ana çizgi Sinyalin altında → ayı fazı.
Renk değişimi etkinleştirilmişse:
- Ana çizgi Lime = Sinyalin üzerinde (boğa kontrolü)
- Ana çizgi Kırmızı = Sinyalin altında (ayı kontrolü)
4. Kesişim noktaları
- Yeşil nokta (Yukarı Kesişim) → ana çizgi sinyalin üzerine çıkar
-
- olası bir boğa dönüşünün başlangıcı.
- Kırmızı nokta (Aşağı Kesişim) → ana çizgi sinyalin altına iner
-
- olası bir ayı dönüşünün başlangıcı.
Bu sinyalleri her zaman yapı / fiyat hareketi ve daha yüksek zaman dilimi bağlamıyla birleştirin.
Parametreler (İngilizce)
DTF Çekirdek
- Hızlı Uzunluk – hızlı EMA periyodu (varsayılan 12).
- Yavaş Uzunluk – yavaş EMA periyodu (varsayılan 26).
- Sinyal Uzunluğu – ana çizgiye uygulanan sinyal SMA periyodu (varsayılan 9).
Görüntüleme
- Ana ve Sinyali Göster – iki çizgiyi açar/kapatır.
- Kesişim Noktalarını Göster – ana/sinyal kesişimlerinde noktaları gösterir.
- Histogramı Göster – arka plandaki histogramı açar/kapatır.
- Ana Çizgiyi Sinyal Kesişimine Göre Renklendir?
-
- AÇIK → ana çizgi Lime sinyalin üzerinde, Kırmızı altında.
- KAPALI → ana çizgi Kırmızı kalır.
- 4 Renkli Histogram Kullan?
-
- AÇIK → aqua / mavi / kırmızı / bordo mantığı.
- KAPALI → histogram tek bir gri renktir.
Gösterge profili
4.0
Değerlendirmeler: 1
5 | 0 % | |
4 | 100 % | |
3 | 0 % | |
2 | 0 % | |
1 | 0 % |
Signal
Indices
Commodities
GBPUSD
RSI
Bollinger
Fibonacci
Scalping
AI
XAUUSD
NAS100
MACD
BTCUSD
Forex
Breakout
EURUSD
NZDUSD
Martingale
Prop
ZigZag
Supertrend
Fair Value Gap
SMC
Crypto
Grid
Stocks
ATR
USDJPY
VWAP
cTrader Store üzerinden erişilebilen işlem botları, göstergeler ve eklentiler gibi ürünler, üçüncü taraf sağlayıcılar tarafından sağlanır ve yalnızca bilgilendirme ve teknik erişim amaçlarıyla sunulur. cTrader Store bir broker değildir ve yatırım tavsiyesi, kişisel öneriler vermez veya gelecekteki performansı garanti etmez.


!["[Hamster-Coder] Moving Average MTF" logosu](https://cdn.ctrader.com/image/webp/b11b98b1-194d-4b8e-b00e-d611826ad159_31226)
!["[Hamster-Coder] Bollinger Bands" logosu](https://cdn.ctrader.com/image/webp/21d8e5d6-fb11-4bac-b9ee-cd05c2b76804_30327)


42.11M
İşlem hacmi
6.13M
Kazanılan pip
203
Satışlar
7.88K
Ücretsiz yüklemeler