
Trend Cycle
Gösterge
181 i̇ndirmeler
Sürüm 1.0, Nov 2025
Windows, Mac
Açıklama
Trend Cycle sadece yön değil, trend süresine odaklanan bir trend analiz aracıdır.
Şunları yapar:
- Bir Hull Moving Average (HMA) eğimine dayanarak boğa ve ayı trendlerini tespit eder.
- Şu anki trend kaç bar aktif olduğunu sayar (Gerçek Uzunluk).
- Son yukarı trendlerin ve aşağı trendlerin uzunluklarını ayrı ayrı depolar.
- Boğa ve ayı trendlerinin ortalama uzunluğunu hesaplar (Boğa ort. / Ayı ort.).
- Şunları çizer:
-
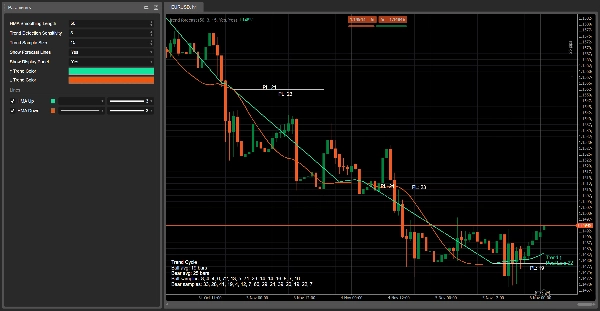
- Boğa trendlerinde yeşil HMA ve ayı trendlerinde kırmızı HMA.
- Her trendin başlangıcında, yatay projeksiyon çizgileri ve
PL: 18gibi bir etiket (Muhtemel Uzunluk bar cinsinden). - Trend yönünü ve Gerçek Uzunluğu gösteren canlı bir etiket mevcut fiyatın yakınında.
- Şunları içeren bir gösterim paneli:
-
- ortalama boğa ve ayı trend süresi,
- seçilen örnek boyutuna kadar olan son trend uzunlukları listeleri.
Amaç size şu soruyu yanıtlamada yardımcı olmaktır:
“Bu trend ne kadar eski ve bu tür trendler genellikle ne kadar sürer?”
Nasıl çalışır (mantık)
- Hull Moving Average (HMA)
Gösterge, kapanış fiyatının Hull Moving Average'sini HMA Düzeltme Uzunluğu parametresi kullanarak hesaplar.
HMA, basit/EMA'dan daha pürüzsüzdür ancak yön değişikliklerine hızlı tepki verir. - Eğimle trend tespiti
Son Trend Tespiti Hassasiyeti bar boyunca HMA'yı kontrol eder:
Bir trend tanımlandığı sürece, bir sayaç (Gerçek Uzunluk) her bar arttırılır, bu da şu anki trendin süresini temsil eder. -
- HMA kesinlikle yükseliyorsa → trend boğa (↑)dır.
- HMA kesinlikle düşüyorsa → trend ayı (↓)dır.
- Aksi takdirde, önceki trend durumu korunur.
- Trend uzunluklarının kaydedilmesi
Trend boğadan ayıya veya tam tersi yönde değiştiğinde: -
- Tamamlanan trendin süresi kaydedilir:
-
- boğa trendleri boğa listesine,
- ayı trendleri ayı listesine.
- Her liste, Trend Örnek Boyutu ile sınırlıdır (örneğin son 10 trend).
- Bu örnekler şunları hesaplamak için kullanılır:
-
- Boğa ort. = ortalama boğa trend uzunluğu.
- Ayı ort. = ortalama ayı trend uzunluğu.
- Muhtemel Uzunluk projeksiyonları
Her yeni trendin başlangıcında, yeterli örnek varsa:
Bu projeksiyonlar grafikte geçmiş olarak tutulur, böylece tahmin edilen ve gerçek trend sürelerini görsel olarak karşılaştırabilirsiniz. -
- O trend türü için ortalama uzunluğu hesaplar (boğa veya ayı).
- Trend başlangıç barından yaklaşık o kadar bar için yatay bir çizgi çizer.
- Çizginin ortasına bir etiket yerleştirir:
-
PL: X→ Muhtemel Uzunluk = X bar.
- Canlı etiket
Her barda, gösterge HMA'nın yakınında tek bir canlı etiket çizer:
Bu, mevcut trend yönünü ve şu ana kadar kaç bar sürdüğünü gösterir. -
- Örnek metin:
-
Trend ↑
Gerçek Uzunluk: 7
- Renk:
-
- Boğa trendleri için yeşil (↑)
- Ayı trendleri için turuncu/kırmızı (↓)
- Gösterim paneli (sol alt)
Gösterim Panelini Göster etkinleştirildiğinde, grafiğin köşesinde statik bir metin paneli görünür ve şunları gösterir:
Bu, o sembol/zaman dilimindeki son trend davranışlarının hızlı istatistiksel bir özetini sağlar. -
- Başlık: Trend Cycle
Boğa ort.: X barAyı ort.: Y barBoğa örnekleri:son boğa trend uzunlukları listesiAyı örnekleri:son ayı trend uzunlukları listesi
Pratikte nasıl okunur
- Yeşil HMA + “Trend ↑”
→ Bir boğa trendi aktiftir.
→Gerçek Uzunlukşu ana kadar kaç bar sürdüğünü söyler.
→ En sonPL: Xçizgisi, benzer boğa trendlerinin genellikle ne kadar sürdüğüne dair görsel bir fikir verir. - Kırmızı HMA + “Trend ↓”
→ Bir ayı trendi aktiftir.
→Gerçek Uzunluk= mevcut ayı trendinin yaşıdır.
→ Hareketin genç mi yoksa olgun mu olduğunu görmek için panelde Gerçek Uzunluk ileAyı ort.karşılaştırın. - Gerçek Uzunluk ortalamaya yaklaştığında veya aştığında (Boğa ort. / Ayı ort.):
→ Mevcut trend, son tarihe kıyasla istatistiksel olarak “eski”dir.
→ Şunları yapmayı tercih edebilirsiniz: -
- zarar durdurmaları sıkılaştırmak,
- kârları güvence altına almak,
- o yönde yeni girişlerde daha temkinli olmak.
- Kısa trendler vs uzun trendler
-
- Birçok çok kısa trend → dalgalı / ortalamaya dönüşen ortam.
- Az sayıda uzun trend → daha yönlü piyasa, geniş hareketlerle.
Özet
YZ özeti
Trend Cycle is a technical indicator designed to analyze trend duration in financial markets. It detects bullish and bearish trends by evaluating the slope of a Hull Moving Average (HMA) applied to closing prices, providing a smoother yet responsive measure of trend direction. The indicator counts the number of bars the current trend has been active (Real Length) and records the lengths of recent up-trends and down-trends separately. Using these samples, it calculates average durations for bullish and bearish trends.
Visual elements include a green HMA line during bullish trends and a red HMA line during bearish trends. Horizontal projection lines mark the probable length of each trend at its start, labeled with "PL: X" to indicate expected duration in bars. A live label near the current price displays the active trend direction and its age in bars. An optional display panel offers a summary of average trend durations and recent trend length samples.
Trend Cycle helps users assess how long the current trend has lasted relative to historical trends, aiding decisions such as adjusting stops or managing entries. It supports analysis across various markets including Forex, cryptocurrencies, indices, commodities, and stocks.
Gösterge profili
Müşteri değerlendirmeleri
0.0
Değerlendirmeler: 0
Müşteri değerlendirmeleri
Bu ürün için henüz bir değerlendirme yok. Ürünü denediniz mi? O zaman ona dair görüşlerini paylaşan ilk kişi olun!
Tartışma
SSS
BTCUSD
Forex
Signal
Breakout
Indices
EURUSD
Commodities
GBPUSD
NZDUSD
Martingale
Bollinger
Prop
ZigZag
Scalping
Supertrend
Crypto
Grid
Stocks
AI
XAUUSD
NAS100
USDJPY
cTrader Store üzerinden erişilebilen işlem botları, göstergeler ve eklentiler gibi ürünler, üçüncü taraf sağlayıcılar tarafından sağlanır ve yalnızca bilgilendirme ve teknik erişim amaçlarıyla sunulur. cTrader Store bir broker değildir ve yatırım tavsiyesi, kişisel öneriler vermez veya gelecekteki performansı garanti etmez.


Fiyat
42.11M
İşlem hacmi
6.13M
Kazanılan pip
230
Satışlar
8.52K
Ücretsiz yüklemeler