
الوصف
مذبذب سوبر تريند
مذبذب سوبر تريند المبسط - الوصف الكامل
نظرة عامة
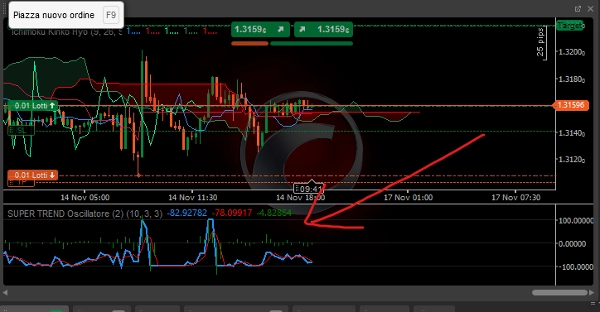
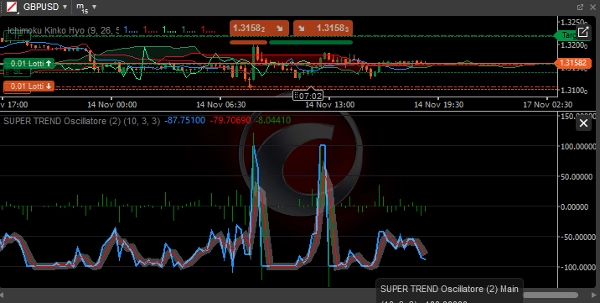
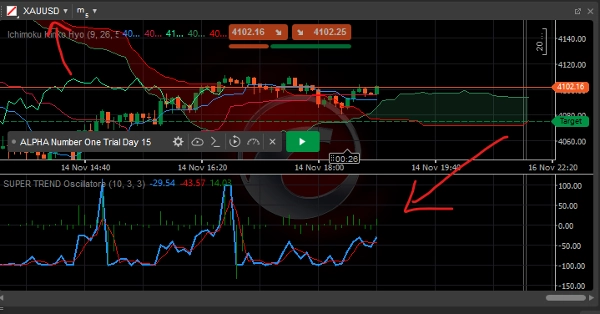
المذبذب سوبر تريند المبسط هو مؤشر فني متقدم لمنصة cTrader يحول سوبر تريند الكلاسيكي إلى مذبذب بصري، مما يسهل تحديد اتجاه الاتجاه وقوته وموثوقيته.
المكونات الرئيسية
1. الخط الرئيسي (أزرق)
- الوظيفة: يعرض المسافة المعيارية بين السعر وخط سوبر تريند
- الحساب:
((السعر - سوبر تريند) / (ATR × المضاعف)) × 100 - التفسير:
-
- > 0: اتجاه صاعد (السعر فوق سوبر تريند)
- < 0: اتجاه هابط (السعر تحت سوبر تريند)
- النطاق: من -100 إلى +100
2. خط الإشارة (أحمر)
- الوظيفة: المتوسط المتحرك البسيط للخط الرئيسي
- الفترة: قابلة للتخصيص (الافتراضي 3 فترات)
- الاستخدام: يفلتر ضوضاء السوق ويؤكد الإشارات
3. المدرج التكراري (رمادي)
- الوظيفة: الفرق بين الخط الرئيسي وخط الإشارة
- التفسير:
-
- إيجابي: تسارع الزخم الصاعد
- سلبي: تسارع الزخم الهابط
- عبور الصفر: احتمالية انعكاسات الزخم
المعلمات القابلة للتكوين
معلمات سوبر تريند:
- فترة ATR: فترة حساب متوسط المدى الحقيقي (الافتراضي: 10)
- المضاعف: مضاعف لشرائط سوبر تريند (الافتراضي: 3.0)
معلمات المذبذب:
- فترة الإشارة: فترة خط الإشارة (الافتراضي: 3)
تفسير الإشارة
شروط الاتجاه:
- اتجاه صاعد قوي:
-
- الرئيسي > +50
- الرئيسي > الإشارة
- مدرج تكراري إيجابي
- اتجاه هابط قوي:
-
- الرئيسي < -50
- الرئيسي < الإشارة
- مدرج تكراري سلبي
- سوق متذبذب:
-
- الرئيسي بين -30 و +30
- تقاطعات خط متكررة
إشارات التداول:
دخول طويل:
- عبور الرئيسي فوق 0
- تحول المدرج التكراري إلى إيجابي
- خط الإشارة يؤكد الاتجاه الصاعد
- الرئيسي فوق +20 للزخم
دخول قصير:
- عبور الرئيسي تحت 0
- تحول المدرج التكراري إلى سلبي
- خط الإشارة يؤكد الاتجاه الهابط
- الرئيسي تحت -20 للزخم
الخروج / جني الأرباح:
- طويل: الرئيسي > +80 (تشبع شراء) أو عبور تحت الإشارة
- قصير: الرئيسي < -80 (تشبع بيع) أو عبور فوق الإشارة
مزايا النسخة المبسطة
1. أداء محسن
- حسابات أكثر كفاءة
- استهلاك أقل للموارد
- استجابة أسرع لتغيرات السعر
2. سهولة الاستخدام
- تقليل المعلمات الأساسية
- إشارات بصرية فورية
- تفسير سهل حتى للمتداولين المبتدئين
3. الموثوقية
- أقل عرضة للضوضاء
- إشارات أنظف وأكثر تحديدًا
- تقليل الإشارات الخاطئة مقارنة بسوبر تريند الكلاسيكي
استراتيجيات الاستخدام
استراتيجية متابعة الاتجاه:
- الدخول: الرئيسي > 0 للشراء، الرئيسي < 0 للبيع
- الفلتر: المدرج التكراري له نفس إشارة الرئيسي
- الخروج: انعكاس الإشارة أو الوصول إلى مستويات قصوى
استراتيجية الزخم:
- الدخول: الرئيسي > +30 (شراء) أو الرئيسي < -30 (بيع)
- التأكيد: تسارع المدرج التكراري
- الخروج: تباطؤ الزخم (انخفاض المدرج التكراري)
استراتيجية الانعكاس المتوسط:
- الدخول: الرئيسي > +80 (بيع) أو الرئيسي < -80 (شراء)
- التأكيد: انعكاس المدرج التكراري
- الخروج: العودة نحو المنطقة المحايدة
ظروف السوق المثلى
الأسواق المتجهة:
- كفاءة عالية
- إشارات مطولة
- عدد أقل من التقلبات المفاجئة
الأسواق المتذبذبة:
- تقليل حجم اللوت
- تمديد الإطار الزمني
- استخدام كفلتر للزخم
أفضل الممارسات
الأطر الزمنية الموصى بها:
- داخل اليوم: M15 - H1
- تداول متأرجح: H4 - D1
- تداول موقعي: W1 - MN
إدارة المخاطر:
- وقف الخسارة: 1.5-2 × ATR
- جني الأرباح: 2-3 × المخاطرة
- حجم المركز: 1-2% لكل صفقة
تأكيدات إضافية:
- توافق أطر زمنية متعددة
- تأكيد الحجم
- مستويات دعم/مقاومة رئيسية
القيود
الاعتبارات:
- تأخير متأصل (مؤشر متابعة الاتجاه)
- انخفاض الأداء في الأسواق المتذبذبة
- الحاجة إلى تأكيدات في حالة انخفاض التقلب
التوصيات:
- الدمج مع تحليل حركة السعر
- الاستخدام كفلتر وليس كنظام مستقل
- اختبار تجريبي قبل الاستخدام المباشر
يمثل هذا المذبذب أداة قوية لتحديد الاتجاهات القوية وتصفية الإشارات الخاطئة مع الحفاظ على بساطة التشغيل المناسبة لكل من المتداولين المبتدئين وذوي الخبرة.
الملخص
تقييمات العملاء
5 | 67 % | |
4 | 33 % | |
3 | 0 % | |
2 | 0 % | |
1 | 0 % |


