Açıklama
TRB — Tick Runs Bars Göstergesi
Fiyat Hareketlerinden Önce Piyasa Bilgilerini Tespit Edin
Erken Benimseyenler İçin Sınırlı Süreli Tanıtım Fiyatlandırması - ilk sürüm dönemi sona erdiğinde fiyat standart perakende fiyatına yükselmeden önce, kopyanızı indirimli fiyattan şimdi güvence altına alın.
Sürüm 1.1
Daha fazla detay için Yorumlar Bölümünü kullanın
Satın alma sonrası Kurulum Kılavuzlu Video Oturumu mevcuttur
TICK RUNS BARS (TRB) GÖSTERGESİ
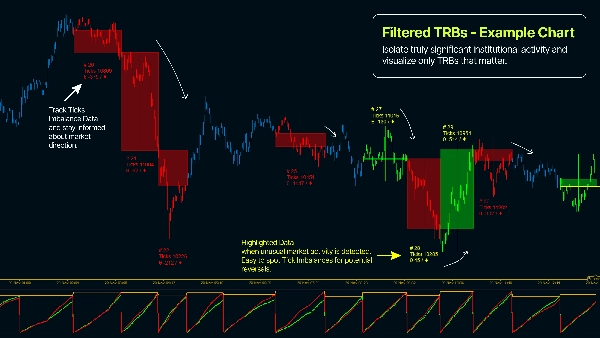
Tick Runs Bars, ticaret akışında yönlü sürekliliği tespit ederek piyasa mikro yapı analizini genişletir. Ayrıca Marcos López de Prado'nun Advances in Financial Machine Learning kitabına dayanan bu gösterge, tek taraflı piyasa baskısının beklenen seviyelerden sapmasını tanımlar — kurumsal emir dilimleme ve koordineli ticaret faaliyetlerini ortaya çıkarır.
Temel İçgörü
Kurumsal yatırımcılar büyük emirleri stratejik olarak gerçekleştirir — bunları daha küçük parçalara böler, hacmi iceberg emirlerinin arkasına gizler veya piyasayı hareket ettirmemek için algoritmik yürütme kullanırlar. Bu taktikler, kalıcı tek yönlü ticaret koşuları şeklinde belirgin izler bırakır. Tick Runs Bars, bir tarafın emir akışında ne kadar süre hakim olduğunu ölçerek bu kalıpları tespit eder ve rastgele fiyat dalgalanmaları yerine kasıtlı, agresif emirlerin gerçekleştiğini ortaya koyar.
Nasıl Çalışır
Gösterge, alım koşusu hacimleri ile satım koşusu hacimlerini ayrı ayrı hesaplar — geleneksel dengesizlik metrikleri gibi birbirinden netleştirmez. Tarihsel alım/satım olasılığı ve ortalama hacimlerden türetilen dinamik beklenen eşik değerine karşı maksimum tek taraflı hacim birikimini (θT) izler. Gerçek yönlü koşular beklentileri aştığında yeni bir TRB çubuğu tetiklenir. Bu, emir akışı yürütmesinin "yapısal şeklini" — kurumsal oyuncuların imzasını — ortaya çıkarır.
Ana Özellikler
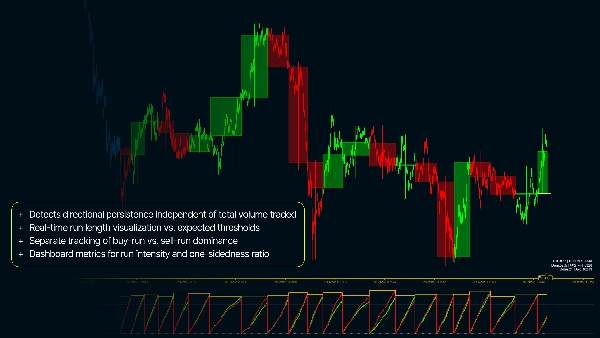
- Toplam işlem hacminden bağımsız olarak yönlü sürekliliği tespit eder
- Beklenen eşiklere karşı gerçek zamanlı koşu uzunluğu görselleştirmesi
- Alım koşusu ve satım koşusu hakimiyetinin ayrı takibi
- Emir yürütme aşamalarını gösteren TRB üyeliğine göre grafik mum renklendirmesi
- Gerçekten önemli kurumsal faaliyetleri izole etmek için Min Hacim Filtresi
- Koşu yoğunluğu ve tek taraflılık oranı için gösterge paneli metrikleri
- Enstrüman volatilitesine uyarlanmış yapılandırılabilir Beklenen Çubuk Boyutu ve EWMA parametreleri
Neden Tick Runs Bars Kullanmalı?
- Kurumsal emir yürütmesini tamamlanmadan önce gerçek zamanlı olarak tanımlayın
- Akış analiziyle gizli likidite ve iceberg emir kalıplarını tespit edin
- Koordine ticareti rastgele piyasa gürültüsünden ayırt edin
- Sadece istatistiksel anormallikler değil, yapısal emir dengesizliklerinden fiyat hareketini yakalayın
- Bilinen kurumsal katılım dönemlerinde giriş/çıkış zamanlaması yapın
- Daha hızlı zaman dilimlerinde avantaj sağlamak için gelişmiş piyasa mikro yapı teorisini uygulayın
- Küçük perakende ticaret sıçramalarından kaynaklanan yanlış sinyalleri azaltın


!["Wyckoff Toolkit [Iridio Capital]" logosu](https://cdn.ctrader.com/image/webp/8acfe6a1-6a8e-4578-9367-9df3af2b1801_27763)


