Açıklama
Kısa açıklama
Trend & Hacim Rejim Haritası, fiyat ve hacmin yönünü ve sürekliliğini ölçen cTrader için bir rejim filtresidir. Size normalleştirilmiş bir trend puanı ve –10 ile +10 aralığında bir hacim trend puanı verir, mumlarınızı ayı kırmızısından boğa yeşiline yumuşak bir gradyanla renklendirir ve mevcut ortamın riskli, risksiz veya sadece gürültülü olup olmadığını gösterir.
🧠 Ne yapar
Bu gösterge, TradingView'den BigBeluga'nın “Rejim Filtresi” mantığını cTrader için uyarlayarak ve net bir trend & hacim rejim haritası olarak sunar.
Yumuşatılmış fiyat & hacim
- Fiyatı yumuşatmak için HLC3 (Yüksek, Düşük, Kapanış ortalaması) hesaplar ve Hull Hareketli Ortalama (HMA) uygular.
- Tick hacmine başka bir Hull Hareketli Ortalama uygular.
Trend puanı (fiyat)
- Son N bar için (
Uzunluk), mevcut fiyatın HMA'sını geçmişteki her HMA değeri ile karşılaştırır:
- Eğer mevcut HMA > geçmiş HMA → trend +1
- Eğer mevcut HMA ≤ geçmiş HMA → trend –1
- Toplam puan –10 … +10 aralığına ölçeklenir → bu Trend değeridir.
Hacim trend puanı
- Aynı mantık, ancak HMA hacmi için uygulanır.
- Sonuç, başka bir normalleştirilmiş puandır –10 … +10 → bu Hacim değeridir.
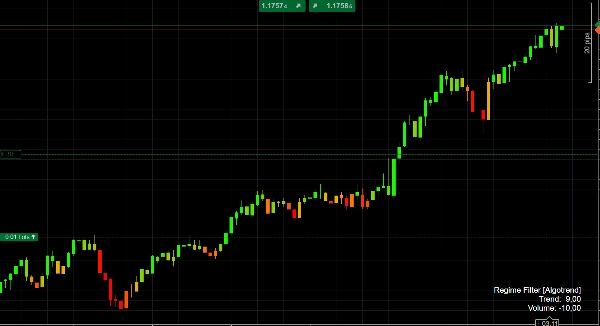
Renk mantığı
- Trend puanı negatif olduğunda, mumlar aşağıdaki gradyanla renklendirilir: kırmızı → turuncu, düşüş rejiminin gücüne bağlı olarak.
- Trend puanı pozitif olduğunda, mumlar turuncu → limon renklerinde olur, güçlü yükseliş rejimleri için daha güçlü yeşil tonlar kullanılır.
Bu size fiyat hareketinin ayı, nötr veya boğa olduğunu ve o rejimin ne kadar süreklilik gösterdiğini anında görsel olarak bildirir.
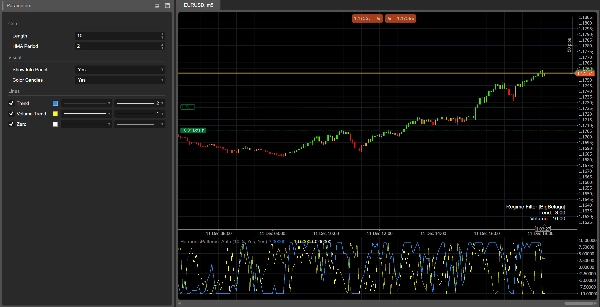
Rejim paneli
Alt pencerede gösterge şunları çizer:
- Trend çizgisi (mavi)
- Hacim trend çizgisi (gri)
- Sıfır çizgisi (temel çizgi)
Son bar üzerinde, mevcut Trend ve Hacim değerleri ile küçük bir bilgi paneli yazdırır.
🎯 Nasıl kullanabilirsiniz
Trend onayı
- Güçlü bir rejimin yönünde işlem yapın, örneğin:
- Trend > +4 → sadece uzun pozisyon eğilimi
- Trend < –4 → sadece kısa pozisyon eğilimi
Rejim filtresi
- Rejim zayıf olduğunda (Trend 0'a yakın) veya Hacim trendi güçlü negatif olduğunda stratejinizi kapatın veya küçültün; bu genellikle dalgalı veya azalan hareketleri işaret eder.
Sinyaller için bağlam
Mevcut giriş sinyallerinizi (fiyat hareketi, harmonik desenler, osilatörler vb.) Trend & Hacim Rejim Haritası ile birleştirin ve bunu bir makro filtre olarak kullanın:
- Trend pozitif ve Hacim trendi de pozitif olduğunda sadece kırılmaları alın.
- Trend çok güçlü olduğunda (> +8 veya < –8) ortalamaya dönüş mean-reversion kurulumlarından kaçının, çünkü piyasa güçlü yönlü bir rejimdedir.
⚙️ Girdi parametreleri
Çekirdek
Uzunluk
Trend ve hacim puanlarını oluşturmak için kullanılan bar sayısı.
- Daha yüksek değerler → daha yumuşak, daha “makro” rejim; değişimi daha yavaş ama daha stabil.
- Daha düşük değerler → daha hızlı tepki, ancak daha fazla gürültü ve daha sık değişim.
HMA Periyodu
Hem fiyat hem de hacmi yumuşatmak için kullanılan Hull Hareketli Ortalama periyodu.
- Zaman diliminize ve ticaret tarzınıza göre ayarlayın: düşük zaman dilimleri için daha kısa, yüksek zaman dilimleri için daha uzun.
Görsel
Bilgi Panelini Göster
Son bar üzerindeki küçük metin panelini, mevcut Trend ve Hacim puanları ile gösterir/gizler.Mumları Renklendir
Mumların Trend değerine göre (kırmızı / turuncu / yeşil gradyan) renklendirilmesini sağlar. Varsayılan grafik renklerinizi korumak isterseniz kapatın.
✅ Yorumlama kılavuzu
- Trend ≥ +7 → güçlü boğa rejimi, mumlar parlak yeşil.
- Trend +3 ile +7 arasında → boğa eğilimi; geri çekilmeler potansiyel dip alım bölgeleridir.
- Trend –3 ile +3 arasında → yatay / dalgalı; sinyaller daha az güvenilirdir.
- Trend ≤ –7 → güçlü ayı rejimi, mumlar koyu kırmızı.
- Hacim trendi > 0 → artan / sürdürülen aktivite, hareketlerin “gerçek” ve kalıcı olma olasılığı daha yüksek.
- Hacim trendi < 0 → azalan katılım, sahte hareketler, dalgalanma veya dönüş riski daha yüksek.
Özet
Müşteri değerlendirmeleri
5 | 0 % | |
4 | 100 % | |
3 | 0 % | |
2 | 0 % | |
1 | 0 % |


