
Açıklama
Meravith Auto, Meravith manuel ticaret sisteminin otomatik bir versiyonudur.
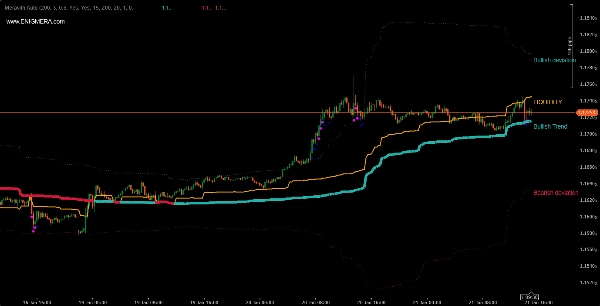
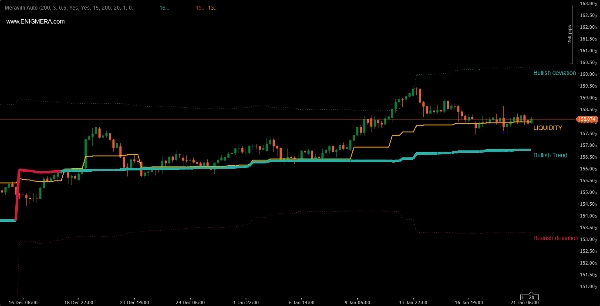
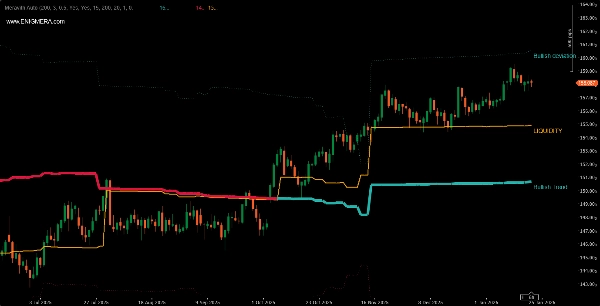
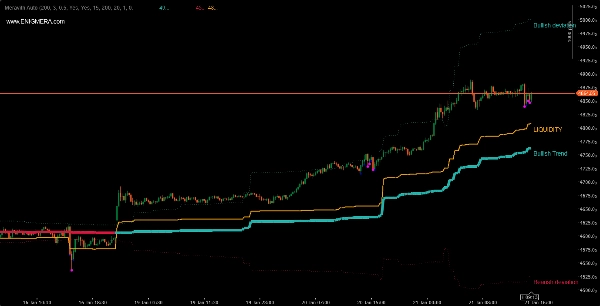
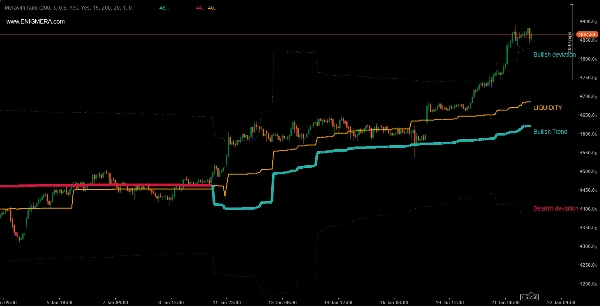
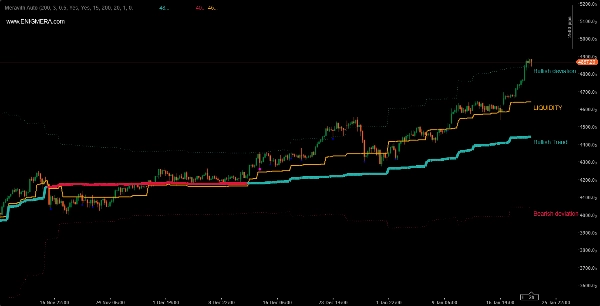
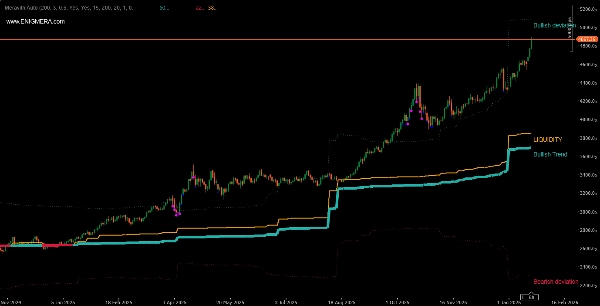
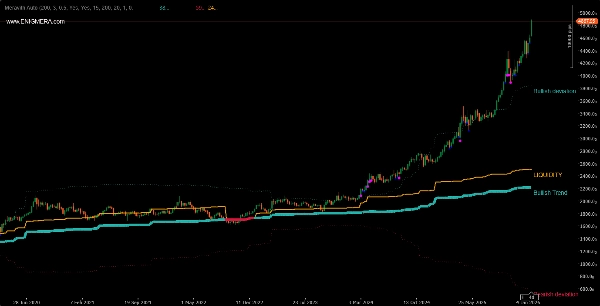
Gösterge şunlardan oluşur:
- Rengini değiştiren trend çizgisi. Boğa piyasasında yeşil, ayı piyasasında kırmızıdır. Bu, trend destek çizgisidir.
- Boğa hacminin ayı hacmine eşit olduğu likidite çizgisi.
- Üçlü boğa sapma çizgisi.
- Üçlü ayı sapma çizgisi.
- Yüksek hacmi gösteren mor ve mavi noktalar. Mor nokta, ortalama hacimden iki sapma daha fazla hacmi, mavi nokta ise iki sapmayı gösterir.
Nasıl kullanılır?
- Boğa trend çizgisi artı trend çizgisinin üzerindeki likidite, boğa trendine eşittir. Piyasanın yukarı hareket etmesini bekleriz. Uzun pozisyonlar açarız.
- Ayı trend çizgisi artı trend çizgisinin altındaki likidite, ayı trendine eşittir. Piyasanın aşağı hareket etmesini bekleriz. Kısa pozisyonlar açarız.
Diğer göstergelerle takdirinize göre birleştirin.
Herhangi bir paritede ve herhangi bir zaman diliminde kullanılabilir.
Farklı brokerların verdikleri hacim nedeniyle farklı sonuçlar görebilirsiniz.
Daha yüksek hacim nedeniyle daha büyük brokerlar tercih edilir.
Otomatik ve manuel versiyonlar arasındaki fark nedir?
- Manuel versiyonda, yüksekler ve düşükler baz alınarak bir trend değerlendirmesi yapılır. Buna göre, piyasadaki hacim tükenme seviyeleri de sağlanır.
- Otomatik versiyonda, farklı piyasa aşamalarında değişen bir dönem vardır. Yüksek volatilite sırasında kısa, düşük volatilite sırasında uzun olabilir. Burada tükenme seviyeleri yoktur, çünkü bir trend değil, bir dönem analiz edilir. Bu nedenle sapmalar vardır. Varsayılan olarak, üçlü sapma gösterilir.
Özet
Gösterge profili
Müşteri değerlendirmeleri
0.0
Değerlendirmeler: 0
Müşteri değerlendirmeleri
Bu ürün için henüz bir değerlendirme yok. Ürünü denediniz mi? O zaman ona dair görüşlerini paylaşan ilk kişi olun!
Tartışma
SSS
BTCUSD
Forex
Signal
Breakout
Indices
EURUSD
Commodities
GBPUSD
NZDUSD
Prop
Scalping
Crypto
Stocks
XAUUSD
NAS100
USDJPY
VWAP
cTrader Store üzerinden erişilebilen işlem botları, göstergeler ve eklentiler gibi ürünler, üçüncü taraf sağlayıcılar tarafından sağlanır ve yalnızca bilgilendirme ve teknik erişim amaçlarıyla sunulur. cTrader Store bir broker değildir ve yatırım tavsiyesi, kişisel öneriler vermez veya gelecekteki performansı garanti etmez.


Fiyat
Başlangıç 24/10/2025