
Açıklama
Bar Force, tüccarlara volatilite genişlemesi ve piyasa momentumu anlarını hızlıca tanımlamada yardımcı olmak için tasarlanmış bir bar güç analiz göstergesidir.
Gösterge, her barı önceki barlara göre göreceli gücüne göre otomatik olarak sınıflandırır ve sayısal bir değeri doğrudan grafikte gösterir. Bu, yakın piyasa bağlamında zayıf, ortalama veya son derece güçlü mumları kolayca tespit etmeyi sağlar.
Tam Sürüm analiz parametreleri üzerinde tam kontrol sağlar ve tüccarların göstergeleri farklı piyasalara, zaman dilimlerine ve ticaret stillerine uyarlamasına olanak tanır.
Ana Özellikler
✔ Otomatik bar güç sınıflandırması
✔ Son piyasa volatilitesine dayalı
✔ Hızlı görsel analiz için doğrudan grafik gösterimi
✔ Fiyat Hareketi, Kopuş ve Momentum ticareti için idealdir
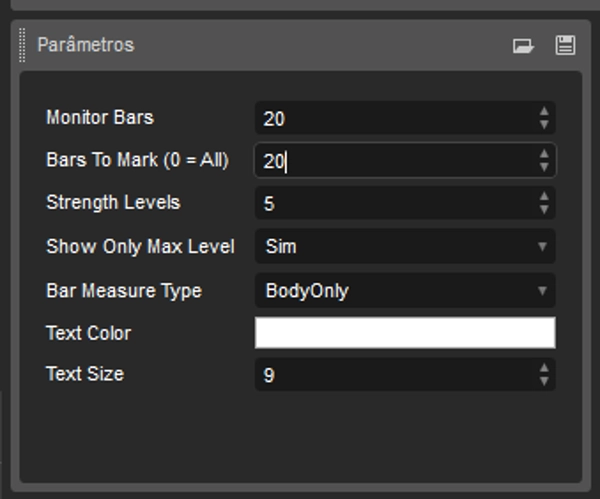
Yapılandırılabilir Parametreler
Tam sürüm tam özelleştirme sunar.
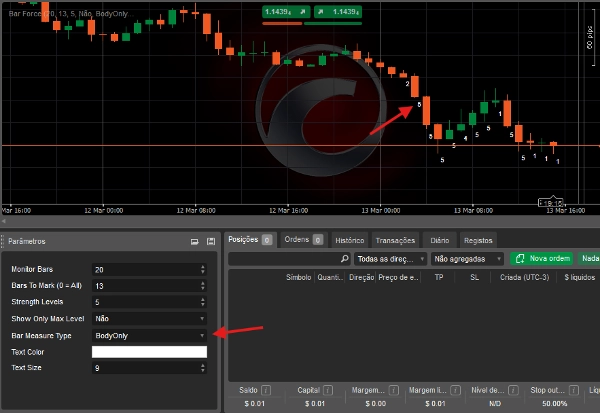
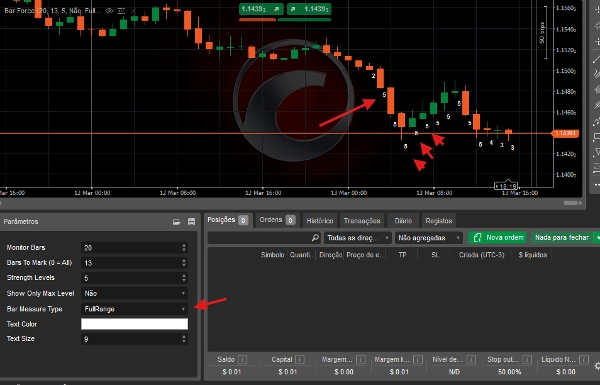
Bar ölçüm türü
Kullanıcılar, her barın gücünün nasıl hesaplanacağını seçebilir:
- Tam Aralık – mumun toplam aralığını kullanır (Yüksek – Düşük)
- Sadece Gövde – sadece mum gövdesini kullanır (Açılış – Kapanış)
Bu, göstergenin hem volatilite analizi hem de yönsel güç analizi için kullanılmasını sağlar.
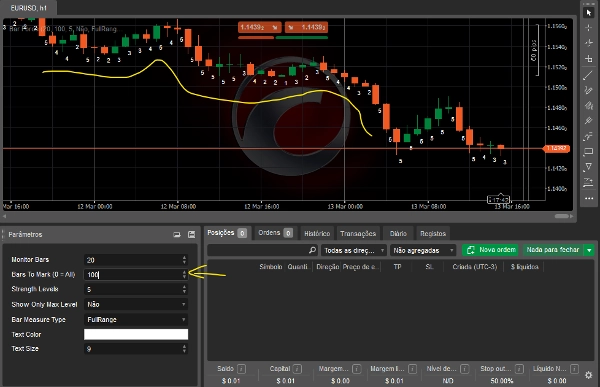
İzleme aralığı
Ortalama piyasa gücünü hesaplamak için kaç önceki barın kullanılacağını tanımlar.
Örnekler:
- 50 bar
- 100 bar
- 200 bar
Bu, göstergenin farklı piyasa koşullarına uyum sağlamasına olanak tanır.
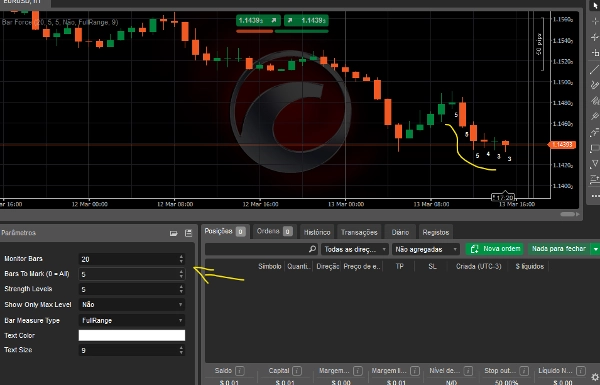
Gösterilen bar sayısı
Tüccarlar, güç sınıflandırmasının grafikte kaç son bar üzerinde gösterileceğini seçebilir.
Örnekler:
- son 5 bar
- son 20 bar
- veya tüm geçmiş
Güç ölçeği
Kaç sınıflandırma seviyesi kullanılacağını tanımlar.
Örnekler:
- 1’den 3’e kadar ölçek
- 1’den 5’e kadar ölçek
- veya özel bir aralık
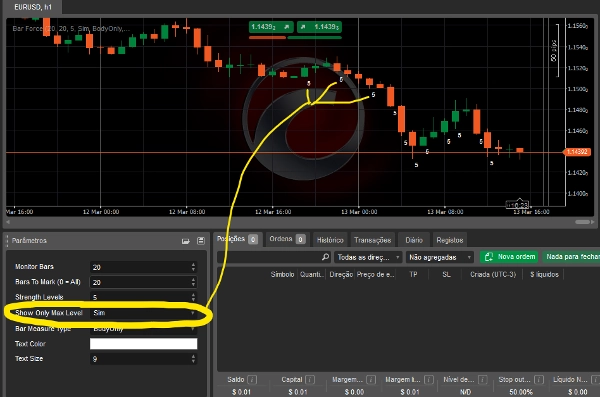
Maksimum seviye filtresi
Sadece maksimum güç seviyesine ulaşan barların gösterilmesi seçeneği, güçlü momentum olaylarını tanımlamayı kolaylaştırır.
Görsel özelleştirme
Kullanıcılar ayrıca şunları ayarlayabilir:
- metin rengi
- metin boyutu
göstergenin grafik düzenleriyle uyum sağlamasına olanak tanır.
Bu gösterge kimler için?
- Fiyat Hareketi tüccarları
- Kopuş tüccarları
- Momentum ve volatilite genişlemesini tanımlamak isteyen tüccarlar
Bar Force, görsel mum analizi işlemini nesnel güç sınıflandırmasına dönüştürür ve tüccarların piyasadaki potansiyel fırsatları hızlıca tanımlamasına yardımcı olur.
Özet
Müşteri değerlendirmeleri
5 | 67 % | |
4 | 33 % | |
3 | 0 % | |
2 | 0 % | |
1 | 0 % |


!["Gaussian Channel [Iridio Capital]" logosu](https://cdn.ctrader.com/image/webp/7c039209-5573-4a54-a072-f9528b503103_41960)


