

Açıklama
Smart Money Suite Pro — cTrader için Tam Kurumsal Fiyat Hareketi Araç Seti
Akıllı para kavramlarını veya kurumsal emir akışına dayalı herhangi bir fiyat hareketi metodolojisini kullanarak işlem yapıyorsanız, acıyı bilirsiniz: grafiğinizde dağınık halde bir düzine gösterge, her biri işi kısmen yapıyor, hiçbiri birbirleriyle iletişim kurmuyor. Smart Money Suite Pro tamamen bunu çözmek için oluşturuldu.
Bu, kurumsal fiyat hareketi ve akıllı para metodolojisi içindeki her büyük kavramı kapsayan tek, kendi kendine yeten bir göstergedir — cTrader için baştan aşağı mühendislik yapılmış, canlı grafiklerde titremeden temiz çalışacak şekilde optimize edilmiş ve gerçek işlem seanslarında gerçekten kullanılabilir kılan yaşam kalitesi özellikleriyle doludur.
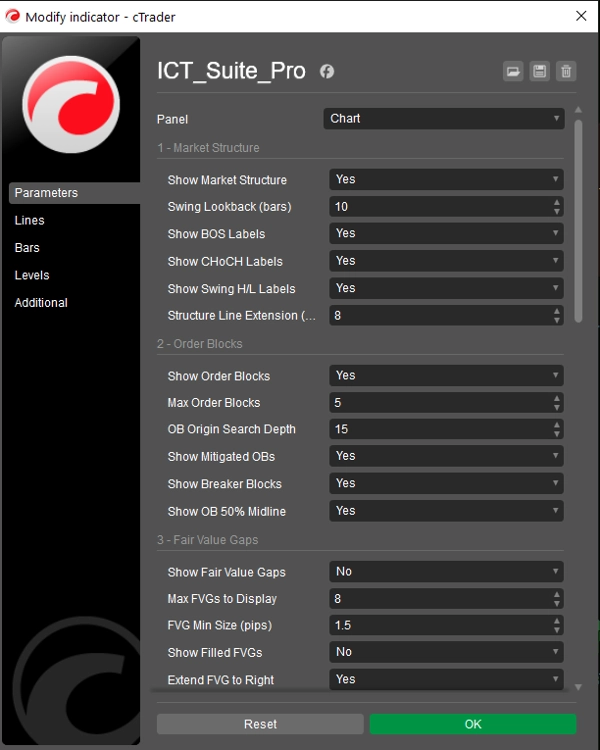
Piyasa Yapısı — Otomatik ve Kesin
Gösterge, onaylanmış salınım yükseklerini ve düşüklerini sürekli olarak tarar, her birini Daha Yüksek Yüksek, Daha Düşük Yüksek, Daha Yüksek Düşük veya Daha Düşük Düşük olarak sınıflandırır. Her Yapı Kırılması (BOS) ve Karakter Değişikliği (CHoCH) tespit edilir ve fiyatın önceki yapıyı tam olarak nerede kırdığını görebilmeniz için noktalı seviye çizgisi ile etiketlenir. BOS (trend devamı) ile CHoCH (trend dönüşü) arasındaki ayrım, anında okunabilmesi için renk kodludur. Salınım geri dönüş derinliği tamamen ayarlanabilir.
Emir Blokları — Tam Yaşam Döngüsü Takibi ile
Emir blokları, onaylanmış bir salınıma yol açan her impuls hareketinden önceki son karşıt mum bulunarak tanımlanır. Her blok, fiyatın bölgeye geri dönüp dönmediğini hızlıca görebilmeniz için grafiğin sağ tarafına uzanan renkli bir kutu olarak çizilir. Bir emir bloğu etkisiz hale geldiğinde, dikdörtgen kaldırılır ve seviyenin kaydını koruyarak grafiğinizi temiz tutan soluk bir metin işareti ile değiştirilir. Fiyat daha sonra etkisiz hale gelmiş bir emir bloğunun diğer tarafından ihlal ederse, bu blok Kırıcı Blok olarak yeniden sınıflandırılır ve renk değiştirilir, potansiyel bir dönüş bölgesini işaret eder. Her aktif bloğun içinde, bölge içindeki prim/indirim ayrımını vurgulamak için %50 orta çizgi çizilir.
Adil Değer Boşlukları — Doldurulana Kadar Takip Edilir
Üç mumluk fiyat dengesizlikleri, tüm geri dönüş penceresi boyunca her iki yönde tespit edilir. Her boşluk, gürültüyü ortadan kaldırmak için yapılandırılabilir minimum pip boyutuyla filtrelenir. Doldurulmamış boşluklar, fiyat onları kapatmak için geri dönene kadar grafiğin sağ tarafına uzatılır; bu noktada ayarlarınıza bağlı olarak ya kaldırılır ya da doldurulmuş olarak işaretlenir. Hem yükseliş hem de düşüş dengesizlikleri aynı anda işlenir.
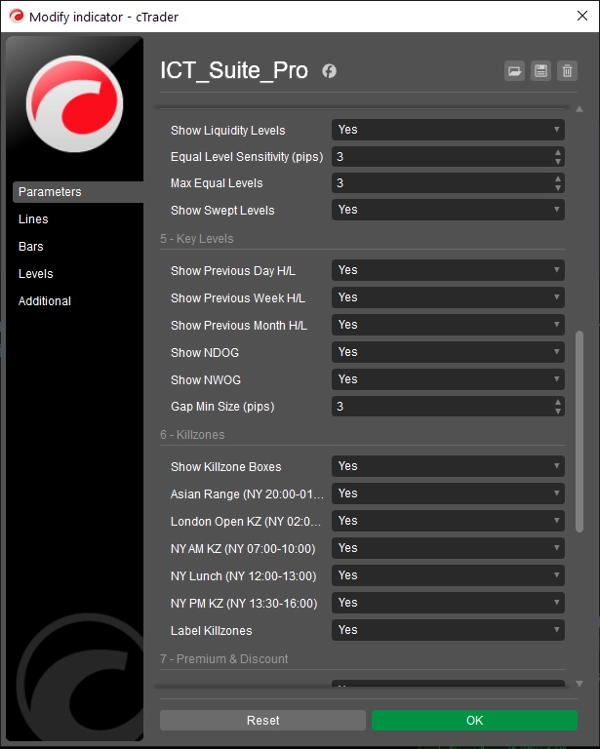
Likidite Seviyeleri — Eşit Yüksekler ve Eşit Düşükler
Gösterge, birbirine yapılandırılabilir pip toleransı içinde oturan salınım yüksekleri veya salınım düşükleri kümelerini tarar — kurumsal emir akışının hedeflediği alım ve satım tarafı likidite havuzlarını tanımlar. Her seviye, her iki salınım noktasında tik işaretleri ve sağa doğru uzanan noktalı bir çizgi ile çizilir. Fiyat bir likidite seviyesini süpürdüğünde, tercihinize bağlı olarak ya gizlenir ya da süpürülmüş olarak işaretlenir.
Ana Seviyeler — Önceki Gün, Hafta ve Ay
Önceki Gün Yüksek/Düşük, Önceki Hafta Yüksek/Düşük ve Önceki Ay Yüksek/Düşük, grafiğinizin kendi fiyat verilerinden otomatik olarak hesaplanır. Tüm tarih sınırları, yerel sistem saatiniz değil, brokerın bar zaman damgalarından türetilir — böylece zaman diliminiz veya enstrüman devri ne olursa olsun doğru kalır. Her seviye çifti, grafikte temiz bir şekilde katmanlanmaları için farklı renk ve çizgi stili kullanır.
Açılış Boşlukları — Günlük ve Haftalık
Gösterge, önceki seansın kapanışı ile mevcut seansın açılışı arasında fiyat boşluğu için her günlük ve haftalık açılışı tarar. Tanımladığınız minimum pip boyutunu aşan herhangi bir boşluk, renkli bir dikdörtgen olarak çizilir. Yeni Gün Açılış Boşlukları ve Yeni Hafta Açılış Boşlukları farklı renklerle ayırt edilir, böylece hangi boşlukların doldurulmadığını anında görebilirsiniz.
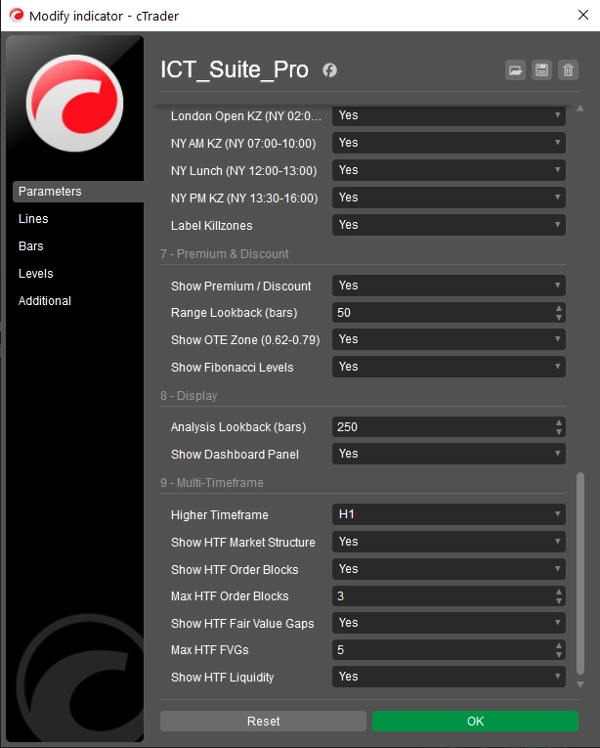
Seans Killzone'ları — Gerçek Aralık Kutuları ile
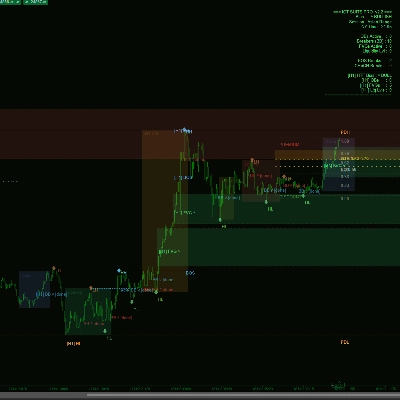
Asya, Londra Açılışı, New York AM, New York Öğle ve New York PM seans pencereleri, her dönemde oluşan gerçek yüksek-düşük aralığını kapsayan dolu kutular olarak çizilir. Saatler New York saatine göre ayarlanır ve EDT/EST yaz saati uygulamasına otomatik olarak uyum sağlar. Her kutu ayrı ayrı açılıp kapatılabilir ve etiketlenebilir. Kutular sabit dikey çizgiler yerine gerçek fiyat aralığını yansıttığı için, her seansın ne kadar aktif olduğunu ve fiyatın uç noktalarını hemen görebilirsiniz.
Prim & İndirim Bölgeleri — Optimal Giriş Aralığı ile
Sürekli bir aralık analizi, yapılandırılabilir bir geri dönüş süresi boyunca en yüksek yüksek ve en düşük düşükü hesaplar. Bu aralıktan, gösterge Denge (0.50), optimal giriş bölgesi (0.62–0.79 Fibonacci) ve tam ana Fibonacci düzeltme seviyeleri setini çizer. Prim ve İndirim etiketleri aralığın içine yerleştirilir, böylece fiyatın mevcut işlem aralığının hangi yarısında işlem gördüğünü her zaman bilirsiniz. Geri dönüş süresi, görünür bar pencerenize otomatik olarak sınırlandırılır, böylece hiçbir seviye göremediğiniz barlara referans vermez.
Çoklu Zaman Dilimi Katmanı — Öne Çıkan Özellik
MTF sistemi, mevcut grafiğin barlarını zaman hizalı slotlarda toplayarak daha yüksek zaman dilimi mumlarını yeniden oluşturur — ayrı bir veri aboneliği gerekmez. Açılır menüden daha yüksek zaman diliminizi seçin (M5, M15, M30, H1, H4, D1) ve Smart Money Suite Pro, daha yüksek zaman dilimi Emir Blokları, Adil Değer Boşlukları, Piyasa Yapısı ve Likidite Seviyelerini doğrudan mevcut grafiğinizin üzerine hesaplayıp çizecektir. Daha yüksek zaman dilimi öğeleri görsel olarak farklıdır: daha kalın sınırlar, kesikli konturlar ve zaman dilimi etiketi ile ön eklenmiş etiketler (örneğin [H4] OB ^) böylece bir seviyenin hangi zaman dilimine ait olduğunu her zaman bilirsiniz.
Mevcut grafik zaman diliminizle aynı veya daha düşük bir zaman dilimi seçerseniz — imkansız bir yapılandırma — gösterge ekranda net bir uyarı gösterir ve hiçbir şey çizmez, yanıltıcı verilerin görünmesini engeller.
Katman etkin olduğunda, kontrol paneli özel bir daha yüksek zaman dilimi bölümü ile güncellenir; burada HTF eğilimi, aktif emir bloğu sayısı, adil değer boşluğu sayısı ve likidite seviyesi sayısı mevcut zaman dilimi özetiyle birlikte gösterilir.
Canlı Kontrol Paneli
Temiz, sağa sabitlenmiş bir panel şunları gösterir: mevcut piyasa eğilimi, aktif işlem seansı, New York saati, tüm aktif emir blokları, kırıcı bloklar, adil değer boşlukları ve likidite seviyelerinin sayısı, ayrıca geri dönüş penceresinde tespit edilen toplam BOS ve CHoCH kırılma sayısı. Çoklu zaman dilimi katmanı etkinleştirildiğinde, daha yüksek zaman dilimi özeti otomatik olarak aşağıya eklenir.
Canlı İşlem İçin Tasarlandı
Gösterge yalnızca yeni bir bar oluştuğunda yeniden çizilir — her gelen tikte değil — bu da birçok hepsi bir arada göstergede görülen grafik titremesini ortadan kaldırır. Tüm analiz, yapılandırılabilir bir geri dönüş penceresi içinde çalışır, böylece performans, büyük bar sayısına sahip daha düşük zaman dilimlerinde bile tutarlı kalır.


