Açıklama
━━━━━━━━━━━━━━━━━━━━━━━━━━━━━━━━━━━━━━━━
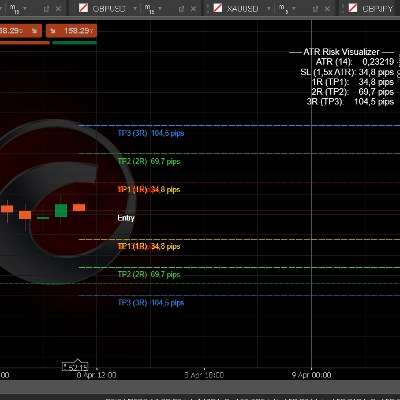
ATR Risk Visualizer — Risk
━━━━━━━━━━━━━━━━━━━━━━━━━━━━━━━━━━━━━━━━
ATR'ye dayalı Stop Loss ve Take Profit seviyelerinizi anında görselleştirir — tam R-çarpan haritalaması (1R'den 5R'ye) ve pip etiketleri ile — böylece pozisyona girmeden önce her zaman tanımlı risk ile işlem yaparsınız.
─────────────────────────────
ANA ÖZELLİKLER
► ATR tabanlı Stop Loss — SL mesafesi ATR × yapılandırılabilir çarpan (varsayılan 1.5×) olarak hesaplanır
► R-Çarpanlı Take Profitler — TP1 (1R), TP2 (2R), TP3 (3R), TP4 (4R), TP5 (5R) mevcut fiyattan otomatik çizilir
► Her seviyede pip etiketleri — SL ve her TP için tam pip mesafesini bir bakışta görün
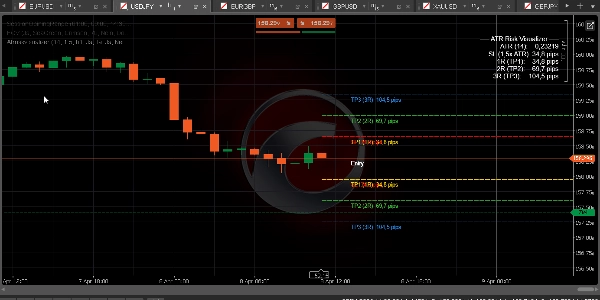
► Aynı anda Long ve Short seviyeleri — veya sadece Long ya da sadece Short moduna geçiş yapın
► ATR Zaman Dilimi seçici — ATR'yi daha yüksek bir zaman diliminden hesaplayın (örneğin M15 grafikte H1 ATR)
► ATR Bilgi Paneli (sağ üst) — ATR değeri, SL büyüklüğü ve TP1/2/3 pip cinsinden gösterilir
► Tam renk kontrolü — SL, TP1, TP2, TP3, TP4/5 için ayrı renkler, yerel cTrader renk seçicileri ile
► Yapılandırılabilir çizgi stili (Düz / Kesik / Noktalı) ve kalınlık
► Giriş referansı olarak Ask veya Bid fiyatı — işlem yönünüze göre seçin
─────────────────────────────
VARSAYILAN AYARLAR
→ ATR Periyodu 14
→ ATR Çarpanı 1.5× (SL = 1.5 × ATR)
→ ATR Zaman Dilimi H1
→ TP1/2/3 Gösterimi AÇIK
→ TP4/5 Gösterimi KAPALI
→ Yön Her İkisi (Long + Short)
→ SL Renk Kırmızı
→ TP1 Renk Altın
→ TP2 Renk LimeGreen
→ TP3 Renk DodgerBlue
→ Çizgi Stili Kesik
─────────────────────────────
NASIL KULLANILIR
1. Göstergiyi herhangi bir grafiğe ekleyin
2. ATR Periyodu ve Çarpanını stratejinize uygun şekilde ayarlayın (Forex/Altın için standart 1.5× ATR'dir)
3. Daha düzgün SL boyutlandırması için ATR Zaman Dilimini H1 veya H4 olarak ayarlayın
4. Pip değerlerini doğrudan grafik etiketlerinden okuyun
5. İlk kısmi çıkış için TP1 (1R), zarar-kesme için TP2 (2R), tam hedef için TP3 (3R) kullanın
6. Tam bir SMC giriş iş akışı için BOS/CHoCH ve FVG göstergeleri ile birleştirin
─────────────────────────────
İDEAL KULLANIM
✔ Riski tam olarak boyutlandırması gereken FTMO ve prop firması traderları
✔ İşlem yönetimi için R-çarpanlarını kullanan SMC ve ICT traderları
✔ Herhangi bir zaman diliminde Forex, Altın ve Endeks traderları
✔ Her giriş öncesi net görsel risk haritası isteyen traderlar
✔ Pozisyon boyutlandırmada sistematik bir yaklaşım geliştiren herkes
─────────────────────────────
UYUMLULUK
→ Platform cTrader (Masaüstü & Web)
→ Varlık sınıfları Forex, Endeksler, Emtialar, Kripto CFD'leri
→ Zaman dilimleri Tümü (M1'den MN'ye)
→ Erişim Hakları Gerekmez
→ Hesap türü Canlı & Demo
━━━━━━━━━━━━━━━━━━━━━━━━━━━━━━━━━━━━━━━━
Özet
Müşteri değerlendirmeleri
5 | 50 % | |
4 | 50 % | |
3 | 0 % | |
2 | 0 % | |
1 | 0 % |


!["Gaussian Channel [Iridio Capital]" logosu](https://cdn.ctrader.com/image/webp/7c039209-5573-4a54-a072-f9528b503103_41960)