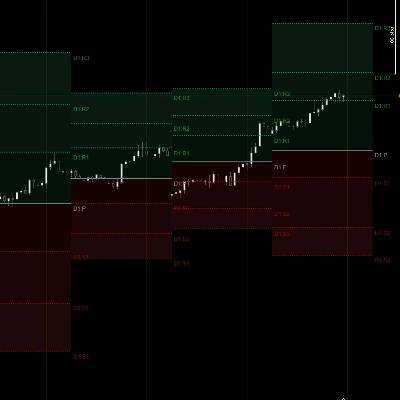
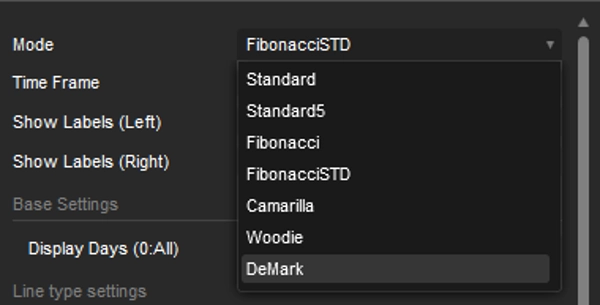
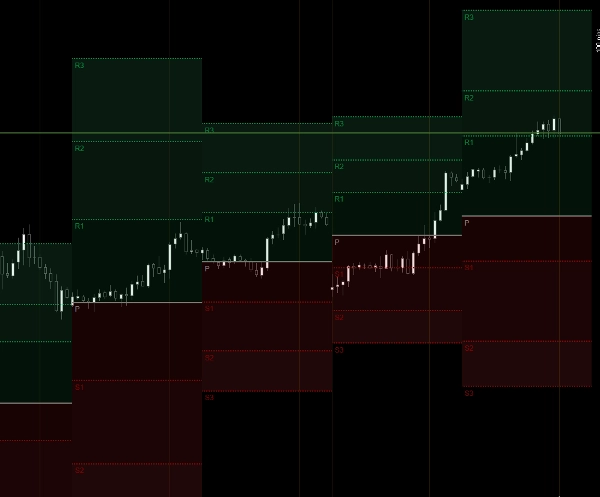
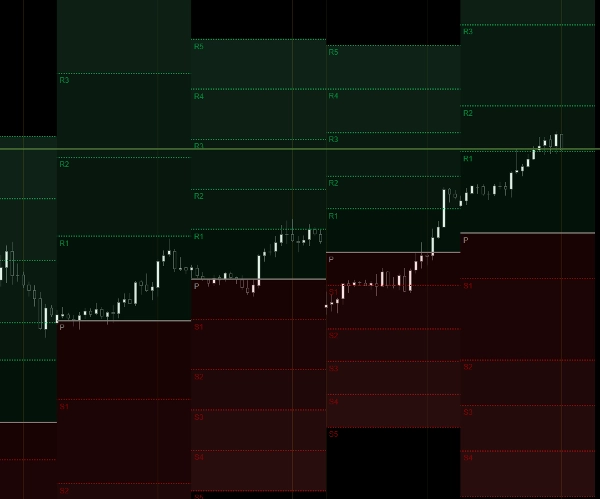
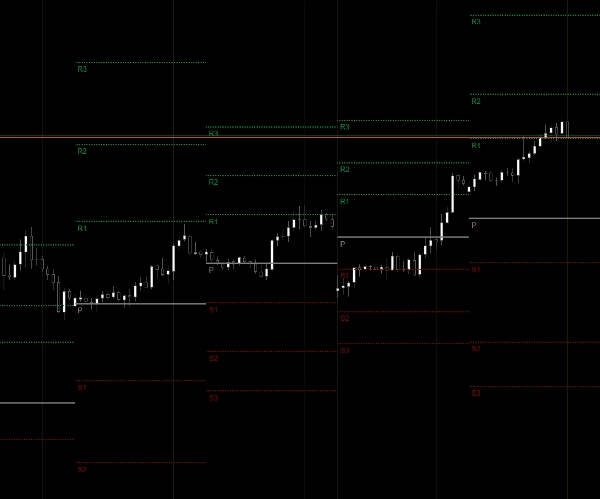
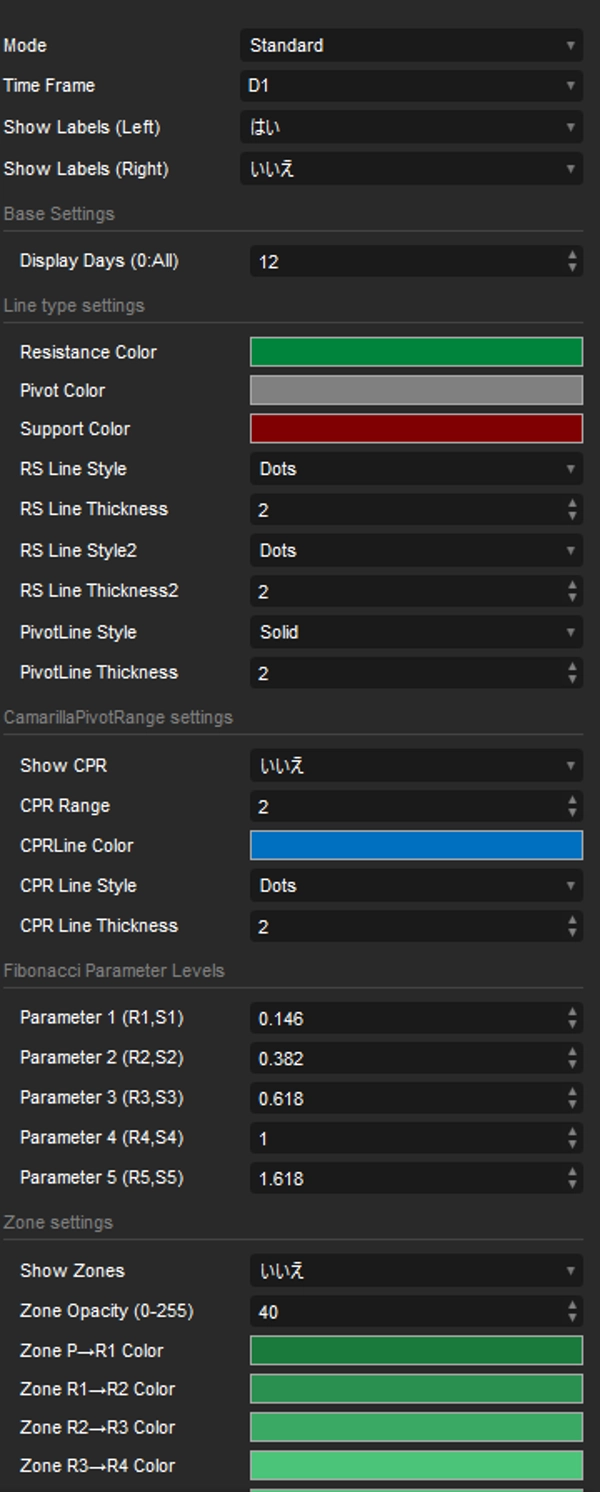
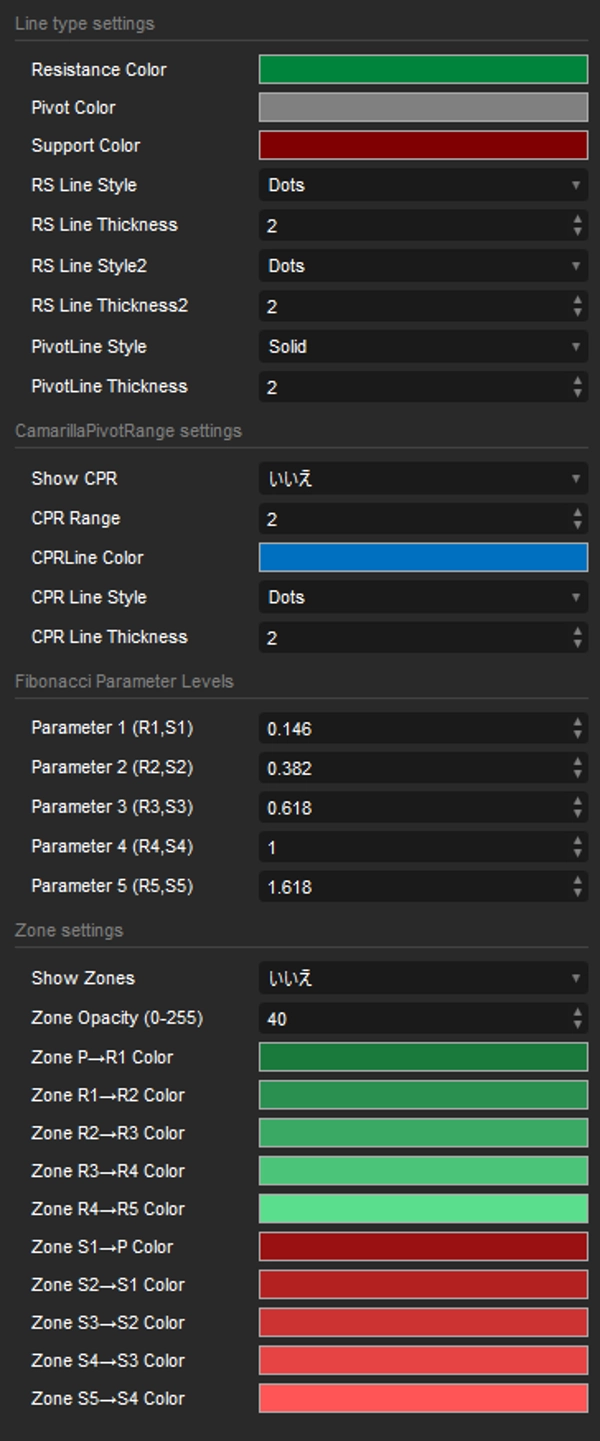
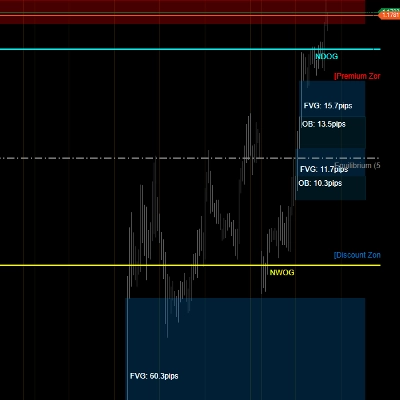
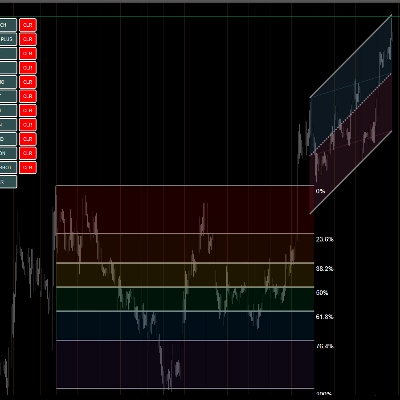
"All PivotPoint Pro" logosu
All PivotPoint Pro
"All PivotPoint Pro" yüklenen resmi
Başlangıç 30/01/2025

AllPivotPointPro is a complete pivot‑point analysis tool supporting Standard, Fibonacci, Camarilla, Woodie, and DeMark modes. It automatically draws pivot, support, and resistance levels, CPR ranges, and multi‑level zones with customizable colors and opacity. The indicator displays both left‑side labels and right‑side TF‑based price labels (e.g., D1:R1), making intraday structure easy to read. Zone shading between each level provides clear visual context, while DisplayDays allows selective historical visibility. Designed for traders who rely on precise, clean, and multi‑mode pivot mapping for daily and intraday decision‑making.

Gösterge profili
0.0
Değerlendirmeler: 0
Müşteri değerlendirmeleri
Bu ürün için henüz bir değerlendirme yok. Ürünü denediniz mi? O zaman ona dair görüşlerini paylaşan ilk kişi olun!
Support & Resistance
cTrader Store üzerinden erişilebilen işlem botları, göstergeler ve eklentiler gibi ürünler üçüncü taraf sağlayıcılar tarafından sağlanır ve yalnızca bilgilendirici ve teknik erişim amaçları için sunulur. cTrader Store bir broker değildir ve yatırım tavsiyesi, kişisel öneriler vermez veya gelecekteki performansı garanti etmez.

Bu oluşturanın diğer ürünleri

Detects and draws FVG, OB, NWOG, NDOG, and Equilibrium zones with auto mitigation and visual labeling.
A multifunctional drawing suite offering channels, Fibo tools, Gann tools, regression, and one‑shot ZigZag with a fully

Şunları da beğenebilirsiniz

Bollinger Bands Advanced Squeeze & Breakout System, Real-Time On-Chart Dashboard, Auto-Squeeze Detector, Dual-Band Cloud
This extraordinary multi-timeframe support and resistance indicator is nothing short of market wizardry.
Clean trend indicator using CCI & ATR. Highlights up/down trends with adaptive, no-repaint lines.
Adaptive Median Filter calculates price median to eliminate noise and extreme values.
Market Sessions is very important for traders.
Spot market structure shift with ease, overlay timeframes, avoid false breakouts with open close pivots, hide chart bars
"High TF Plotter" logosu
4.6
(3)
Ücretsiz
Captra High TF Plotter visualizes high timeframe Bar on lower timeframe charts, highlighting with bull/bear colors.
A straightforward yet effective tool signals entry points for both buying and selling. It incorporates FVG...
Volume Weighted Average Price (VWAP)
Automatically detects and marks higher highs, lower highs, lower lows and higher lows.Check the other version in my page
"MACD  -  advanced" logosu
$ 20
/
$30
MACD Advanced -- It combines the standard MACD logic with a rich set of visual tools
Learn candlestick patterns with live signals, objective rules, context notes, and an interactive quiz training mode.
Pro Heikin Ashi Visual Overlay – Clean Trend Visualization
Identify and trade breakouts with Consolidation Zones! Visualize price consolidation areas for trading opportunities.
Volume Profile plots traded volume at each price level, highlighting high activity zones of precise support & resistance
Maps intraday and multiday structure using Fibonacci-projected session ranges.
IR Candle Open plots customizable opening price lines for daily, weekly, and monthly candles
Başlangıç 30/01/2025