present
Registe-se e receba 50 $ de desconto na sua primeira compra
Trading product for Correlation Meter Indicador Premium/Discount  RSI, image 1
Correlation Meter
Indicador
Versão 1.0, Apr 2026
Windows, Mac
Trading product for Correlation Meter Indicador Premium/Discount  RSI, image 2
Trading product for Correlation Meter Indicador Premium/Discount  RSI, image 3
12.28M
Volume negociado
31.27K
Pips ganhos

Descrição

Track correlation divergences before the market corrects.

Most traders know that XAUUSD and DXY move inversely. Or that XAUUSD and XAGUSD tend to move together. What they don't have is a tool that tells them when that relationship breaks down and what to do about it.

Correlation Meter calculates a live Pearson correlation coefficient between any two symbols using log-returns (the statistically correct input for financial data). It then compares that short-term reading against a longer historical average and fires an alert the moment the gap becomes significant.

How it works

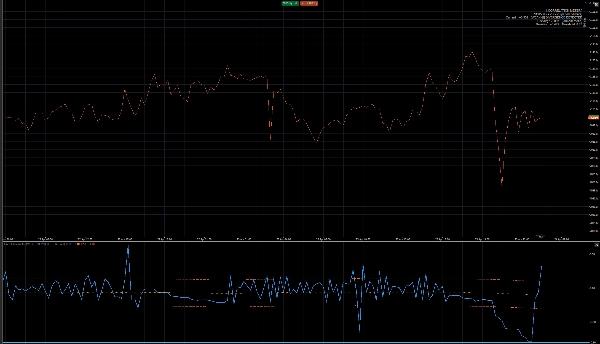
The indicator opens in a sub-window below your chart, similar to RSI. A blue line shows the current 50-bar correlation. An orange dotted line shows the 200-bar historical average. Two red bands mark the divergence threshold. When the blue line breaks outside those bands, the correlation between your two symbols has shifted beyond its normal range meaning one symbol has lagged behind the other and a statistical reversion is probable.

A colour-coded overlay panel in the corner of your chart shows correlation strength at a glance: from Very Strong (≥0.90) down to None (<0.30).

Risk warning

If you hold two highly correlated positions open at the same time. For example XAUUSD long and XAGUSD long with a +0.93 correlation the indicator flags a red warning that your actual risk exposure is nearly double what it appears. Two positions are not two separate bets if they move as one asset.

Pre-configured pairs

Works with any two symbols your broker offers. Suggested starting pairs: XAUUSD/DXY, XAUUSD/XAGUSD, USOIL/USDCAD, EURUSD/DXY, SPX500/VIX.

Parameters

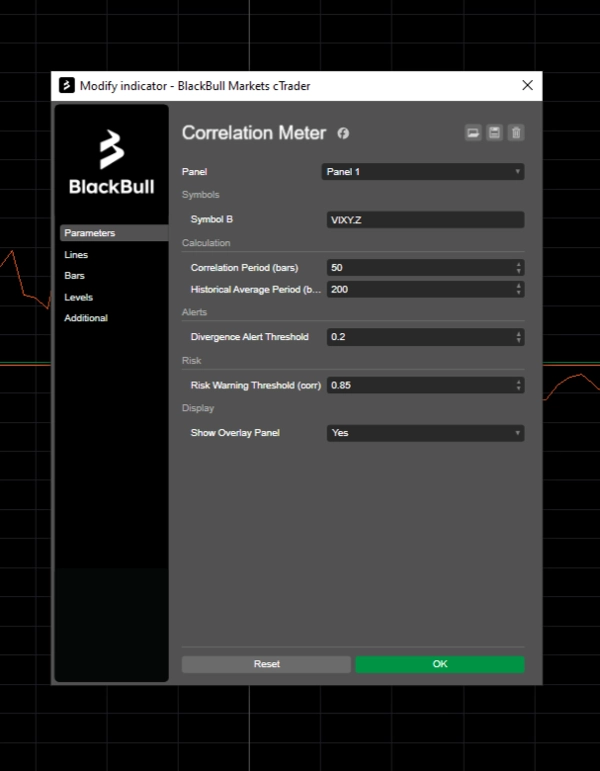
All key settings are adjustable: correlation period, historical average period, divergence threshold, and risk warning sensitivity. No coding required.
Resumo

Perfil do indicador
Categoria do indicador
Estatísticas
Tipo de resultado
Sinais
Requisitos de dados
Apenas barras
Sinais suportados
Divergência
Força da tendência

Conversa

Avaliações de clientes

0.0
Avaliações: 0
Avaliações de clientes
Ainda não há avaliações para este produto. Já o experimentou? Seja o primeiro a contar a outras pessoas!

Perguntas frequentes

Premium/Discount
RSI
Imbalance
Market Structure
Os produtos disponíveis através da cTrader Store, incluindo bots de negociação, indicadores e plugins, são fornecidos por programadores terceiros e são disponibilizados apenas para fins informativos e de acesso técnico. A cTrader Store não é um corretor e não fornece aconselhamento em matéria de investimento, recomendações pessoais ou qualquer garantia de desempenho no futuro.

Mais deste autor

Indicador
Prop
Forex
+11
Detects revenge trades in real time and shows exactly how much they've cost you, before the next one makes it worse.

Também poderá gostar de

Indicador
Prop
Forex
+12
Identify and trade breakouts with Consolidation Zones! Visualize price consolidation areas for trading opportunities.
Indicador
ADX
ATR
+5
Configure, simulate, and analyze trading strategies with custom filters, multi-target exits, and detailed performance me
Indicador
Drawdown Monitor
Protect your funded account. Real-time Daily Equity Drawdown monitor with Green / Orange / Red flashing alerts.
Indicador
VWAP
Support & Resistance
Trading.FC$_vwap Algo shows VWAP trends, dynamic support/resistance and deviation bands to spot potential trade entries.
Indicador
RSI
MACD
This indicator is a combination of MACD and RSI into one. This is perfect fusion and powerful indicator ever.
Indicador
Supertrend
Moving Average
Adaptive MA anchored to structural trend changes — no fixed period. Dual Supertrend + swing detection.
Indicador
AI
ATR
+26
MacD Custom Indicator-Multiple Time Frame
Indicador
Shows daily and sessions highs / lows and session boxes, everything configurable
Indicador
Prop
Forex
+13
Identifies market compression zones and explosive Breakout moments using mathematical modeling.
Indicador
Key Levels
Spots key hourly ranges and signals breakouts using arrows & colored background zones. Ideal for Gold.
Indicador
RSI
Forex
+6
🚀 QQEX Trinity Indicator - The Ultimate Trading Filter 🚀
Indicador
Doji
Volume
+5
Instantly spot high-liquidity institutional moves with clean, non-obtrusive triangle alerts on cTrader charts.
Indicador
ATR
EMA
+5
Candle timer with live profit tracking on chart – displays pips, currency value, and percentage in real time.
Indicador
Signal
Trades Opening Range Breakouts Indicator with dynamic stops/targets adapting to market volatility.
Logótipo de "MA Sabres"
Popular
4.2
(4)
$19
Indicador
Conquer the markets with MA Sabres! This indicator spots trend flips with MAs and cool Sabre shapes & alerts.
Indicador
Allow trader to draw multi trendlines in different timeframes on one chart,Give trader an overview of the current market
Indicador
Laguerre RSI: smoother, faster RSI with less noise. Great for spotting reversals and timing entries.
Indicador
CandleCounterAlex – Candle Cycle Counter with Colors and Adjustable Position.

Preço

12.28M
Volume negociado
31.27K
Pips ganhos