
Description
Unlock the hidden structure of the market with an all-in-one institutional-grade indicator that fuses Volume Profile, VWAP Bands, Order Flow Signals, and Auction Market Logic into a single, unified workspace. Designed for serious traders who demand depth without clutter, this suite reveals where the market is truly trading — and why.
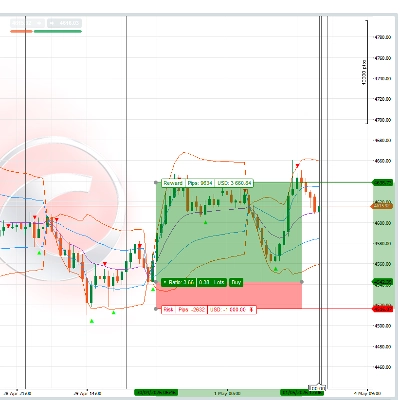
Stop juggling five separate indicators. This suite consolidates volume-at-price analysis, developing value areas, VWAP envelopes, initial balance logic, order flow imbalance, absorption detection, and naked POC tracking into one seamless tool. Whether you scalp intraday breakouts, trade VWAP mean reversion, or map high-probability auction levels, this indicator gives you the complete picture in real time.
Key Features
Advanced Volume Profile & TPO Analysis
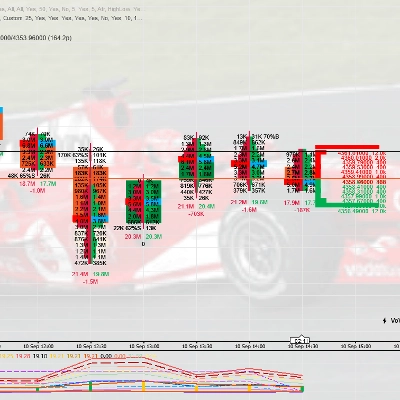
- Full Volume Profile Engine — POC, Value Area (70% default), VAH/VAL, developing profiles, and naked POC tracking with alerts on touch.
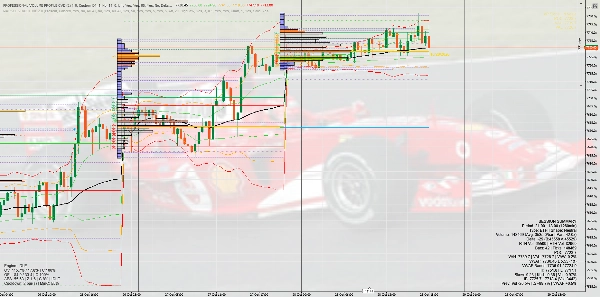
- Multi-Stage VWAP Envelopes — 1σ, 2σ, and 3σ standard deviation bands with configurable line styles and colors.
- Initial Balance Logic — Breakout and re-entry confirmation with close-count validation and optional ATR filtering.
- Order Flow Intelligence — Over-trade (OV) and Order Flow Imbalance (OFI) signals with adaptive participation and z-score thresholds.
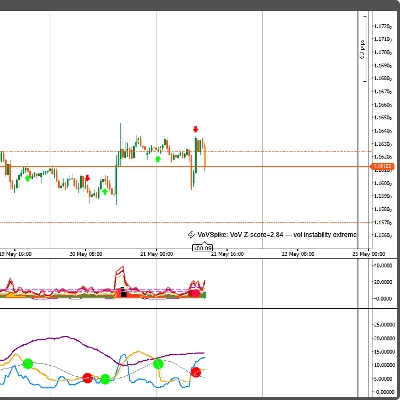
- Absorption Detection — Z-score + volume-confirmed absorption markers for spotting aggressive buyers/sellers being absorbed.
- Liquidity Depth & Volume Panel — Visualize resting liquidity levels and volume distribution directly on your chart.
- Single Prints & Naked POCs — Identify unfinished auction business and high-probability reaction zones.
- Engine Diagnostics & Summary Panels — Real-time confidence scoring, cooldown logic, and a clean on-chart summary.
The "Engine" Signals (Order Flow & Exhaustion)
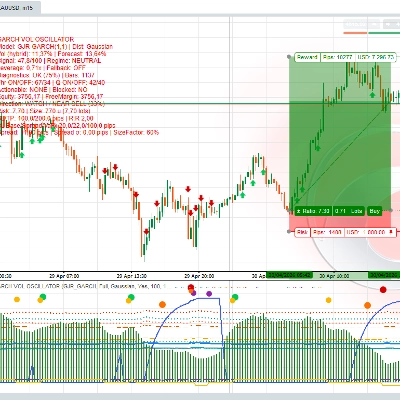
- OFI (Order Flow Imbalance): Detects aggressive buying or selling pressure that contradicts price movement or confirms a breakout.
- Green Triangles/Text: OFI Buy Signal (Aggressive buying).
- Red Triangles/Text: OFI Sell Signal (Aggressive selling).
- OV (Overvaluation/Volume Warning): Identifies when price is overextended relative to volume, Visuals potential reversals or exhaustion.
- Orange Markers: OV Warning (Caution zone).
- VP Signals: Specific signals for "In Value" (price inside the value area) and "VA Breakout" (price leaving the value area with momentum).
Liquidity & Depth
- Liquidity Depth: signalling liquidity clusters above and below the current price to identify potential support/resistance zones.
- Naked POCs: Tracks untested Point of Control levels from previous sessions, which often act as magnets for price.
📊 Visual Guide
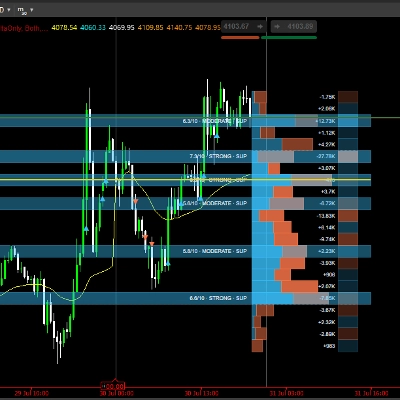
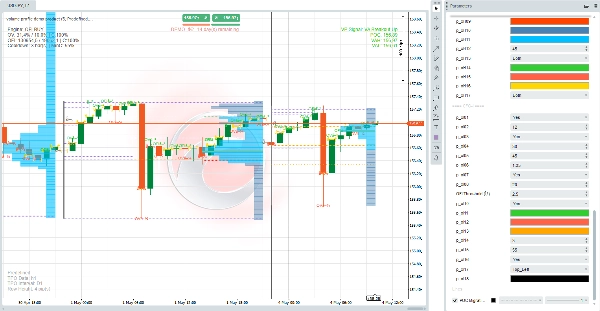
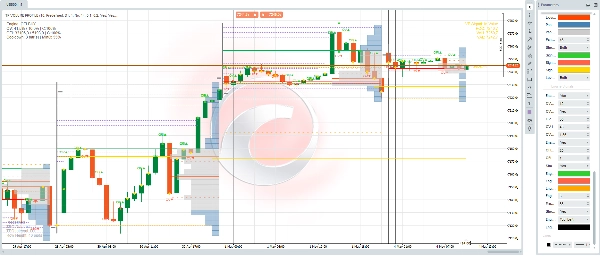
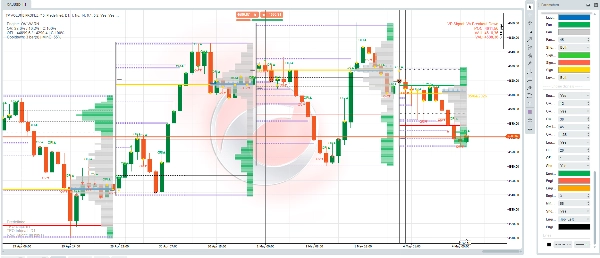
- Histograms: Blue and Grey bars on the right represent volume distribution at specific price levels.
- Signal Markers:
- 🟢 Green Arrows/Text: Buy signals (OFI Buy, VA Breakout Up).
- 🔴 Red Arrows/Text: Sell signals (OFI Sell, VA Breakout Down).
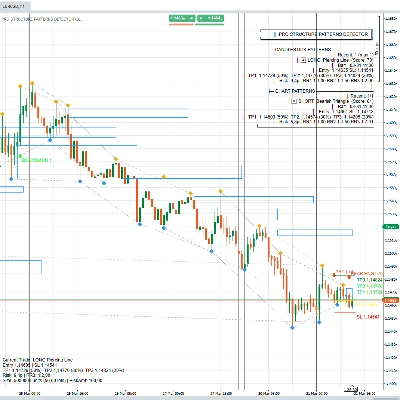
- 🟡 Yellow Lines: Value Area boundaries (VAH/VAL) or Initial Balance levels.
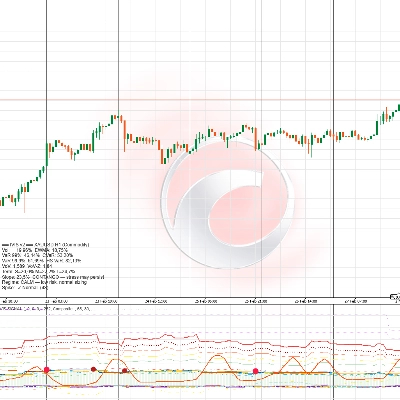
- Info Panel: A dedicated panel in the top-left corner displays real-time statistics:
- Current Engine State (e.g., "OFI BUY", "OV WARN").
- Overvaluation percentages.
- OFI ratios.
⚙️ Customization
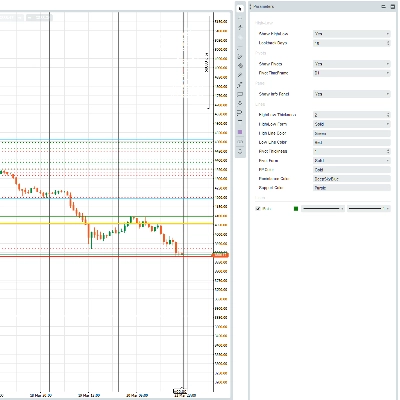
The indicator is highly configurable via the input panel:
- Profile Settings: Adjust Lookback bars, Row Height, and Value Area percentage.
- Engine Settings: Fine-tune OFI and OV sensitivity (Sigma thresholds, Lookback bars).
- Visuals: Change Visuals for POC, VA, Signals, and the Volume Panel to match your chart theme.
💡 Who is this for?
- Day Traders: Use the Initial Balance and Daily Value Areas to plan your session.
- Scalpers: Use OFI and OV signals for precise entry triggers.
- Swing Traders: Identify major support/resistance via Naked POCs and high-volume nodes.
How the Indicators Work Together (One Structure)
The suite is organized into five analytical layers, each feeding the next:
1. Auction Structure Layer (Volume Profile & TPO)
Defines where value is being established.
- POC (Point of Control) — Highest volume price; extended and highlighted for immediate reference.
- Value Area (VAH/VAL) — 70% volume zone with configurable highlighting and extension.
- Developing VA & Initial Balance — Tracks intraday value migration and the first-hour range for breakout logic.
- Single Prints & Naked POCs — Flags unfinished auction levels that often act as magnets.
2. Mean & Deviation Layer (VWAP)
Defines fair value and statistical extremes.
- Developing VWAP — Volume-weighted average price with highlight and extension options.
- VWAP Envelopes — 1σ, 2σ, 3σ bands (green/orange/red) for mean-reversion and trend-continuation setups.
3. Momentum & Flow Layer (OV / OFI)
Defines who is in control.
- Over-trade (OV) Signals — Flags participation extremes using adaptive participation and illiquid thresholds.
- Order Flow Imbalance (OFI) — Z-score-based detection of aggressive directional flow.
4. Absorption Layer
Defines where aggression is being absorbed.
- Absorption Z-Score (2.5 default) — Combined with volume confirmation multiplier (1.5×) to mark high-probability reversal zones.
- Buy/Sell Absorption Markers — Color-coded for instant visual recognition.
5. Visualization & Alert Layer
Ties everything together.
- Volume Panel — Right-side histogram with liquidity depth levels.
- Engine Diagnostics Panel — Confidence scoring, signal cooldowns, and warnings.
- Summary Panel — Compact on-chart overview.
- Verbose Alerts — Naked POC touches, IB breakouts, and signal events.
The logic flows naturally: Auction structure tells you where to look → VWAP tells you if price is stretched → OV/OFI tells you if flow confirms → Absorption tells you if the move is real → Alerts tell you when to act.
Disclaimer: Trading involves risk. This tool is for analysis purposes only and does not guarantee profits. Always backtest strategies before live trading. Unauthorised
2026 DATARUM ALGORITHMICA. All Rights Reserved.
- Intellectual Property: This indicator, including all source code, visual design, algorithms, documentation, and branding, is the exclusive intellectual property of DATARUM ALGORITHMICA. Unauthorised reproduction, distribution, resale, or modification of this product is strictly prohibited.
- No Financial Advice: DATARUM ALGORITHMICA develops and provides professional technical analysis tools for educational and informational purposes only. Nothing contained in this product, its documentation, or associated communications constitutes financial, investment, legal, or tax advice. Users are solely responsible for their trading decisions.
- Risk Warning – CFD & Forex Trading: Trading Contracts for Difference (CFDs), Forex, and other leveraged financial instruments carry a high level of risk and may not be suitable for all investors. You could lose some or all of your invested capital. Past performance of this indicator is not indicative of future results.
- User Responsibility: By purchasing or using this product, you confirm that:
- You are a legally adult in your jurisdiction and authorised to engage in financial trading.
- You understand the risks involved in leveraged trading.
- You accept full responsibility for any losses, damages, or consequences arising from the use of this tool.
Summary
Key features include multi-timeframe volume profiles, tracking of POC migration to assess trend acceptance, automatic calculation of Value Area High/Low, and highlighting of opening ranges for breakout signals. The engine signals detect aggressive buying or selling pressure and potential price exhaustion, visually represented by color-coded markers and arrows. Liquidity depth analysis identifies clusters above and below price levels, while Naked POCs highlight untested support/resistance zones.
The indicator offers extensive customization options for profile settings, engine sensitivity, and visual elements to fit various chart themes. It is suitable for day traders, scalpers, and swing traders seeking detailed market structure insights and order flow context. Real-time statistics are displayed in an info panel for ongoing analysis. This tool is intended for technical analysis and does not provide financial advice.
Discussion
Customer reviews
5 | 100 % | |
4 | 0 % | |
3 | 0 % | |
2 | 0 % | |
1 | 0 % |