
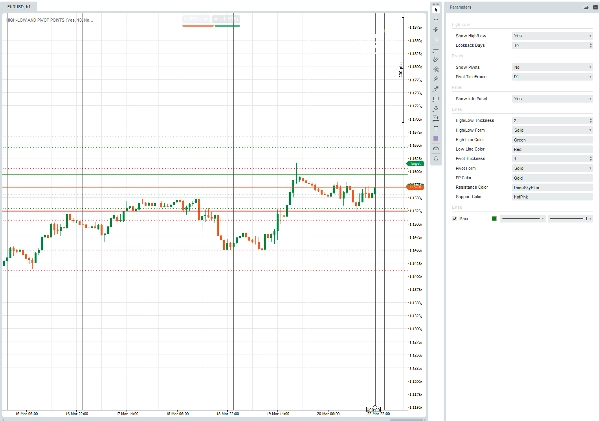
PIVOT POINTS, HIGH-LOW OF THE DAY
Gösterge
108 i̇ndirmeler
Sürüm 1.0, Mar 2026
Windows, Mac
Açıklama
YÜKSEK-DÜŞÜK VE DÖNÜŞ NOKTALARI cTrader üzerine yerleştirilen, günlük yüksek/düşük fiyat seviyelerini ve klasik dönüş noktalarını doğrudan grafiğinizde gösteren bir göstergedir.
Parametrelere genel bakış:
GrupKontrol ettiğiniz şey
Yüksek-Düşük
Çizgileri göster/gizle; kaç önceki günün gösterileceği (Geriye Bakış Günleri)
Dönüş Noktaları
Çizgileri göster/gizle; dönüş hesaplamasını hangi zaman diliminin yönlendirdiği (Günlük, Haftalık, vb.)
Panel
Mevcut fiyatları ve dönüş noktası seviyelerini listeleyen grafik üzerindeki bilgi kutusunu göster/gizle
Çizgiler
Yükseklik, stil (Düz / Noktalı / Çok Noktalı) ve Yüksek, Düşük, PP, Direnç ve Destek çizgileri için renk
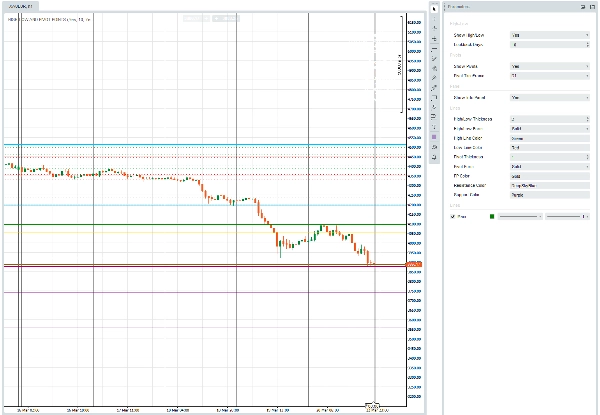
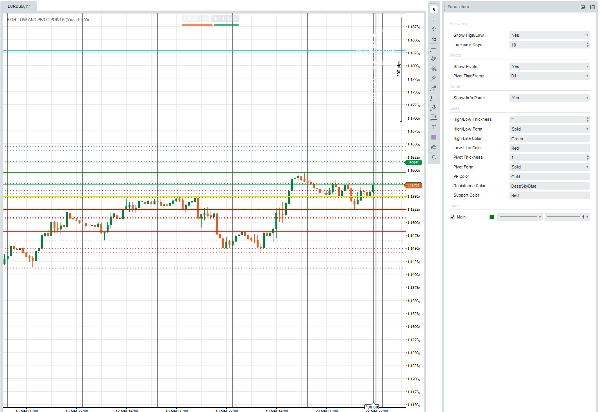
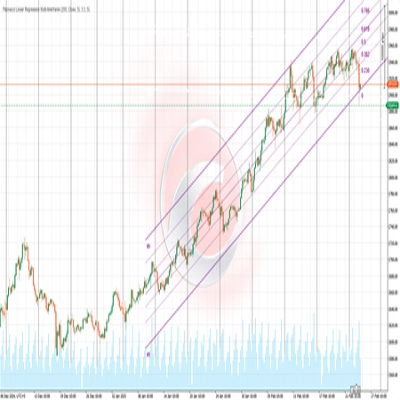
Çizdikleri:
- Seçtiğiniz renklerde bugünün Yüksek/Düşük değerleri; önceki geriye bakış günleri ise aynı renklerin daha açık/ince versiyonunda.
- Yedi standart dönüş seviyesi — PP, R1–R3, S1–S3 — seçilen dönüş zaman diliminizin önceki tamamlanmış çubuğundan hesaplanır.
- Sağ üstte, canlı Günlük Yüksek/Düşük, çok günlük geriye bakış aralığı ve tüm yedi dönüş fiyatını özetleyen bir bilgi paneli.
Özet
YZ özeti
The "Pivot Points, High-Low of the Day" indicator for cTrader overlays daily high and low price levels along with classic pivot points directly on trading charts. It visually displays today's high and low prices, as well as those from prior days based on a configurable lookback period. The indicator calculates and plots seven standard pivot levels—Pivot Point (PP), Resistance levels R1 to R3, and Support levels S1 to S3—derived from the previous completed bar of a selectable timeframe (e.g., daily or weekly). Users can customize visibility, line thickness, style (solid, dotted, very dotted), and colors for all lines including high, low, pivot, resistance, and support. An optional on-chart info panel summarizes live day high/low, multi-day range, and all pivot prices for quick reference. This tool supports multiple markets and symbols including Forex pairs (EURUSD, GBPUSD, NZDUSD, USDJPY), cryptocurrencies (BTCUSD), commodities (XAUUSD), indices (NAS100), and stocks. It is designed to assist traders in identifying key price levels and potential breakout or reversal points based on historical price data and pivot calculations.
Gösterge profili
Müşteri değerlendirmeleri
0.0
Değerlendirmeler: 0
Müşteri değerlendirmeleri
Bu ürün için henüz bir değerlendirme yok. Ürünü denediniz mi? O zaman ona dair görüşlerini paylaşan ilk kişi olun!
Tartışma
SSS
BTCUSD
Forex
Breakout
Indices
EURUSD
Commodities
GBPUSD
NZDUSD
Crypto
Stocks
XAUUSD
NAS100
USDJPY
cTrader Store üzerinden erişilebilen işlem botları, göstergeler ve eklentiler gibi ürünler, üçüncü taraf sağlayıcılar tarafından sağlanır ve yalnızca bilgilendirme ve teknik erişim amaçlarıyla sunulur. cTrader Store bir broker değildir ve yatırım tavsiyesi, kişisel öneriler vermez veya gelecekteki performansı garanti etmez.
Bu oluşturanın diğer ürünleri


Fiyat
49
Satışlar
306
Ücretsiz yüklemeler